
Introduction
VTable: Not only a high-performance multi-dimensional data analytics table, but also a grid artist created between columns!
In modern applications, table components are an integral part, they can quickly display large amounts of data, and provide a good visualization and interactive experience. VTable is a high-performance table component library based on the visual rendering engine VRender, providing users with excellent performance and powerful multi-dimensional analysis capabilities, as well as flexible and powerful graphics capabilities.
Smooth performance experience
VTable is packaged with the visual rendering engine VRender, which provides excellent performance and rendering effects. VTable supports second-level rendering of millions of data, which can quickly display large amounts of data. Let's take a look at an example to show the fast rendering capabilities of VTable. You can also go to the official website to experience it for yourself: https://visactor.io/vtable/demo/performance/100W
Various forms
VTable provides three main table forms, including basic table, multi-dimensional perspective table and perspective combination diagram. It can meet the needs of different users, help users better display and analyze data, and find valuable information from it.
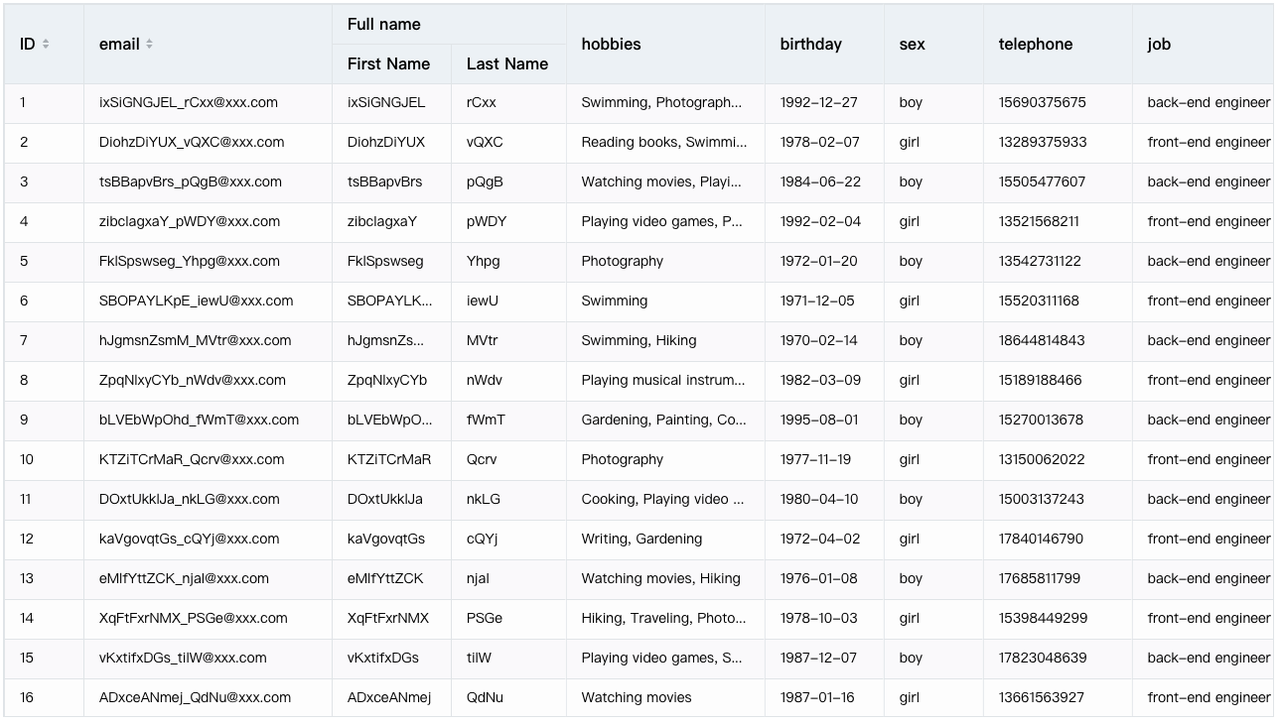
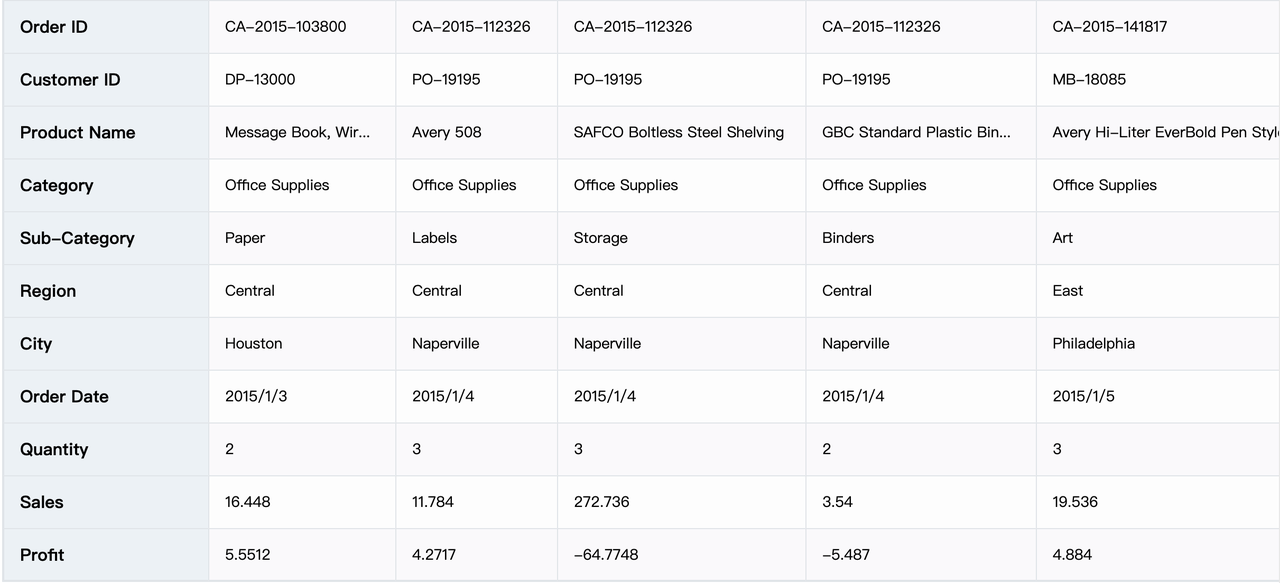
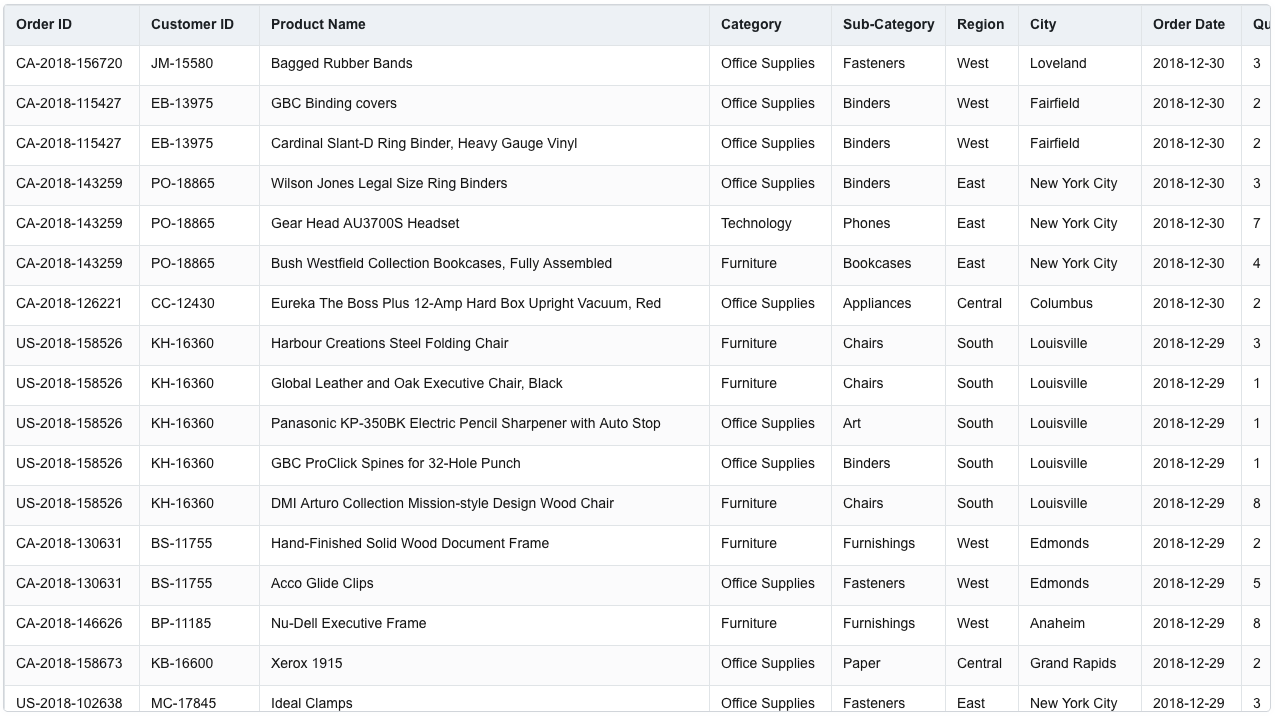
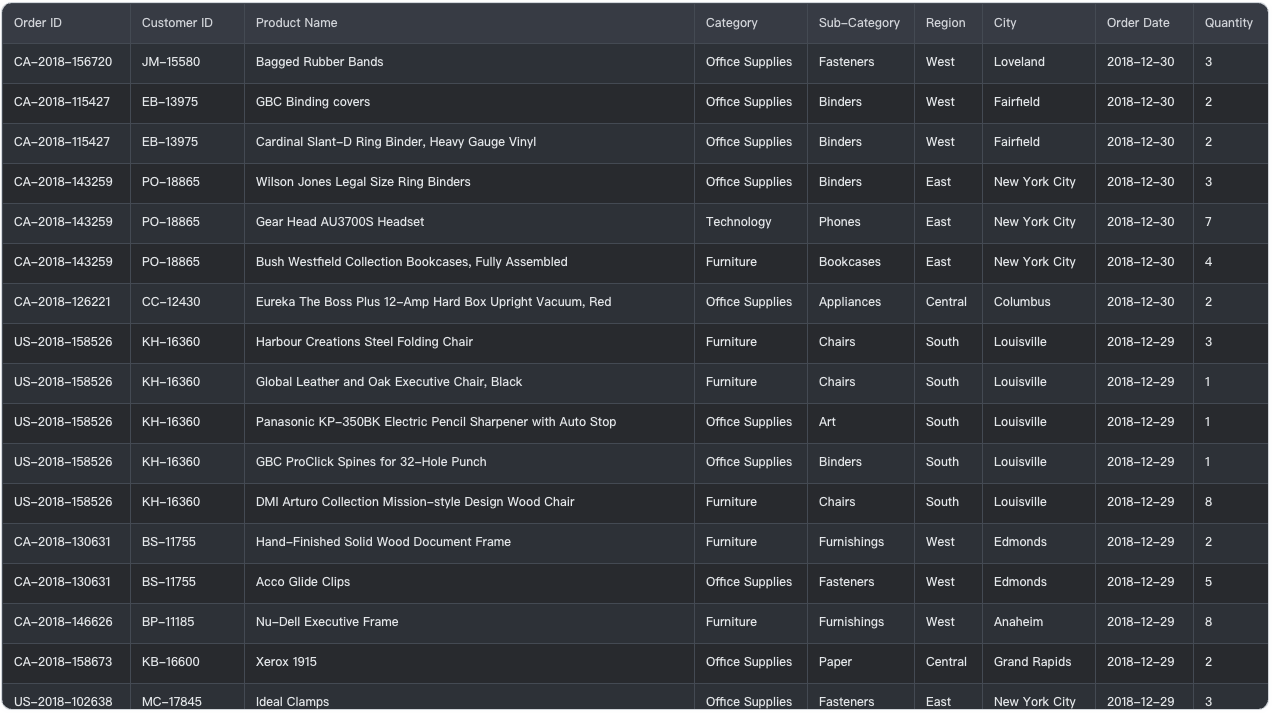
list table
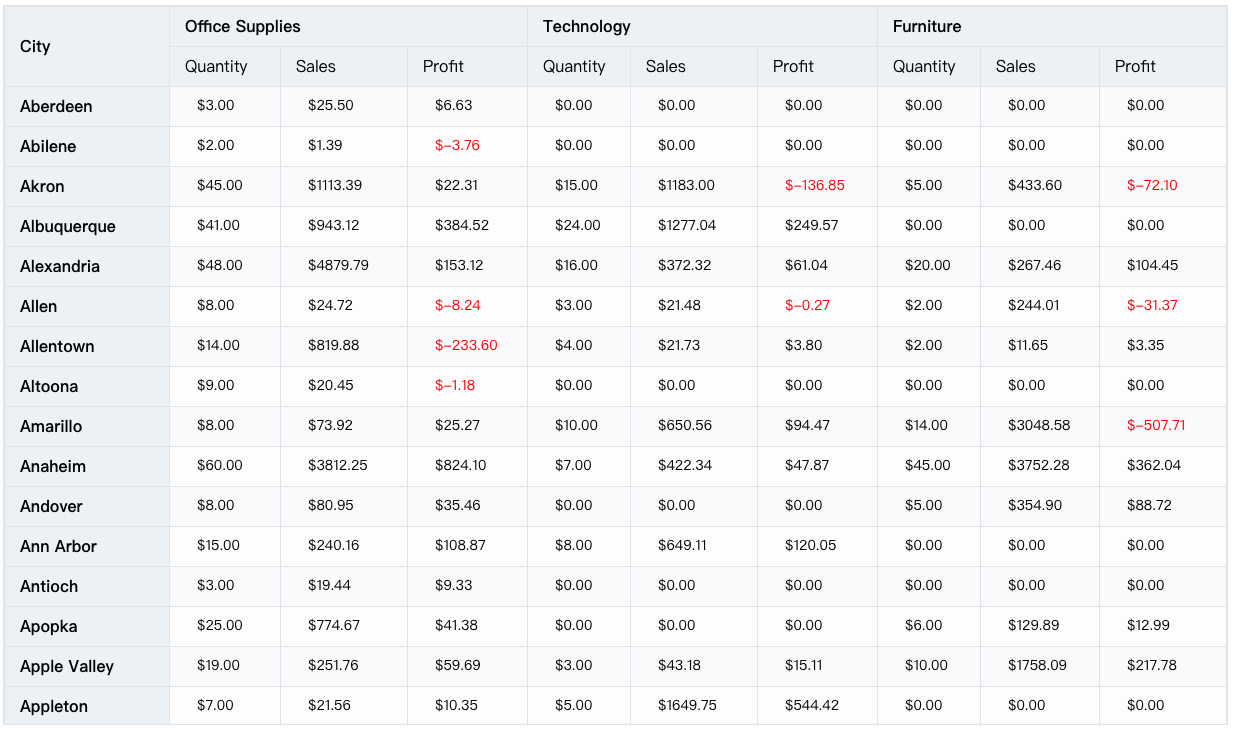
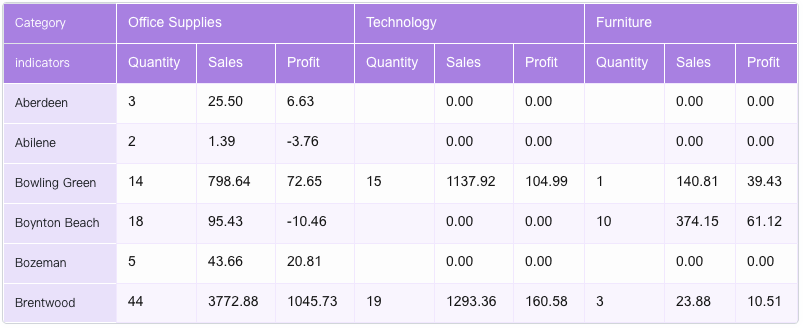
pivot table
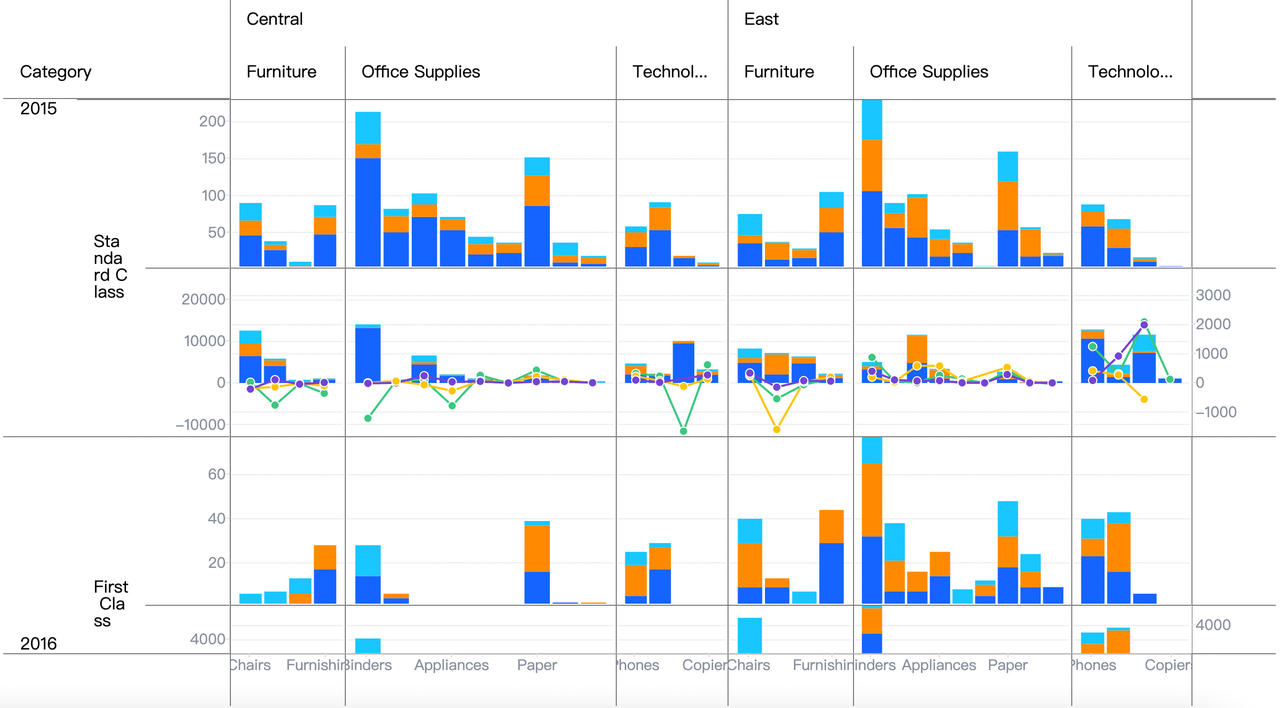
pivot chart
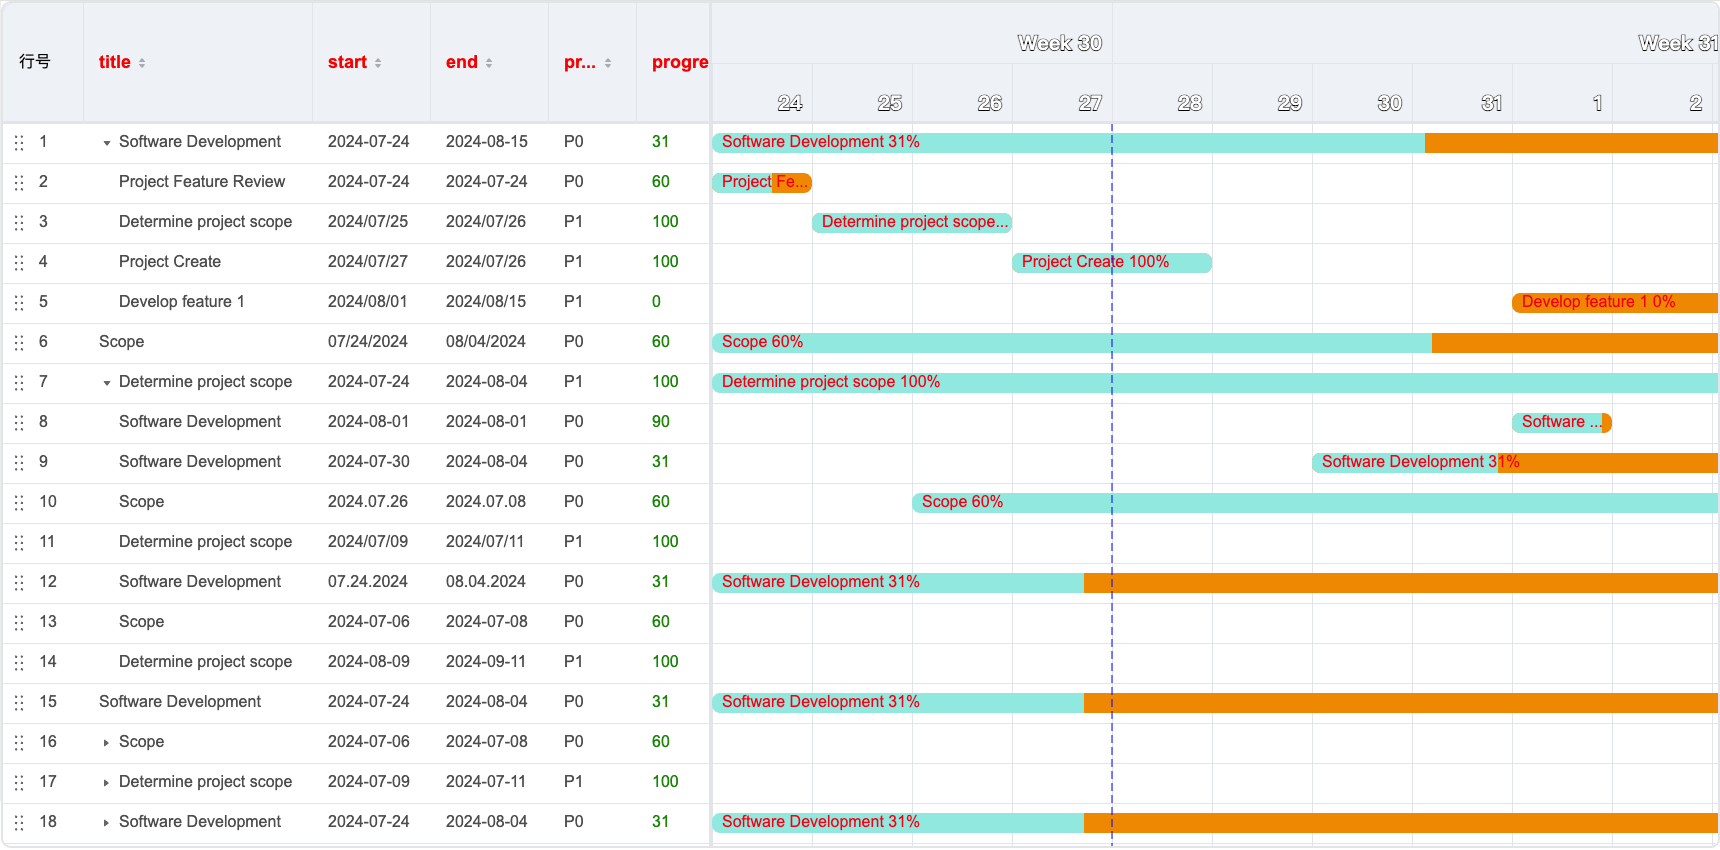
gantt chart
- The basic table is the simplest form of table, it consists of rows and columns, and each cell contains a data item. Basic tables are suitable for simple arrangement and presentation of data.
- Pivot table is a table form for multidimensional data analytics, which can aggregate and summarize data according to multiple Dimensions, providing users with multi-angle data analytics and exploration.
- Pivot chart is a chart form that combines a multi-dimensional perspective table with other chart forms (such as histograms, line charts, etc.), which can transform the data in the perspective table into a more intuitive and understandable graphical display.
- Gantt chart is a chart used to display project progress and resource allocation. It can help users better understand the progress of the project and resource allocation.
At the same time, the basic table can be transformed into a transposed table, and the hierarchical relationship can also be displayed with a tree structure:
list table-transpose
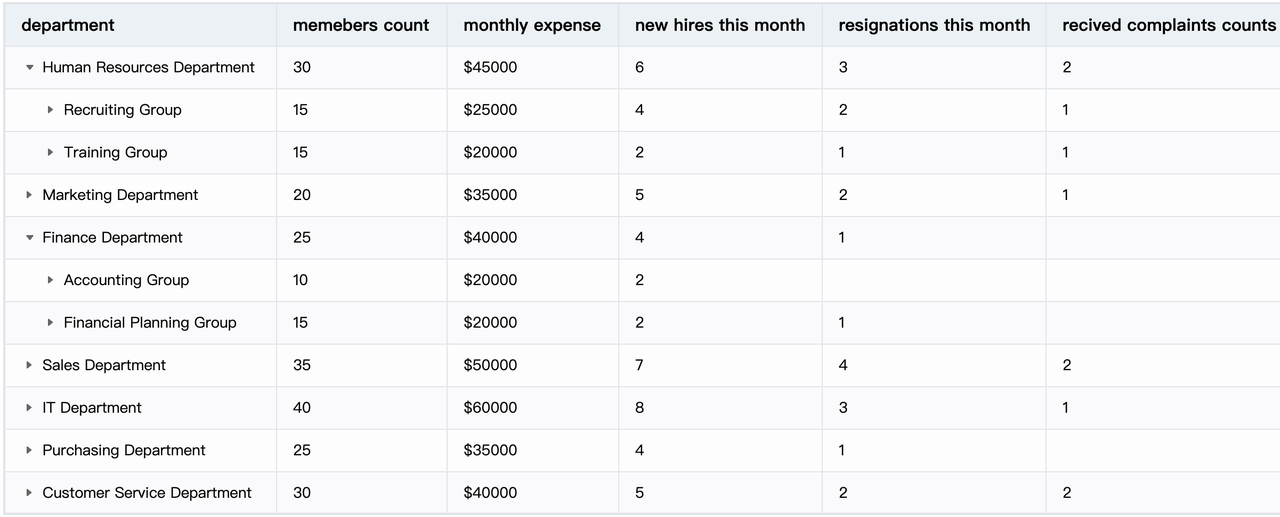
list table-tree mode
The row header of the pivot table can also use a tree structure to show the hierarchical relationship between Dimensions:
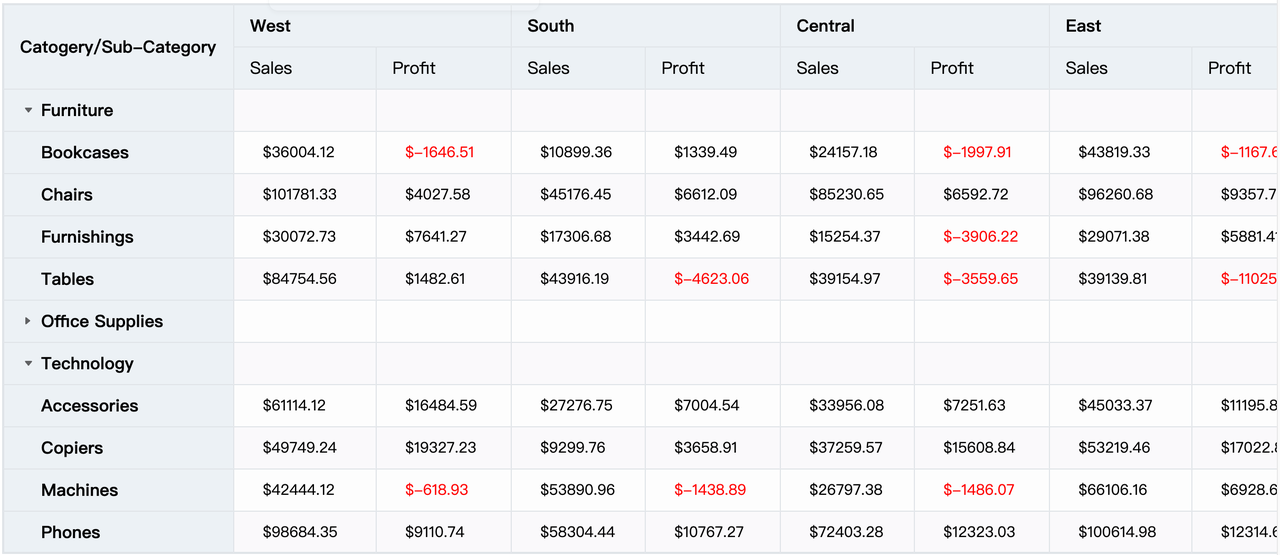
pivot table-tree mode
Rich cell presentation
VTable provides a variety of cell presentation forms, which can meet different data display needs and help users better present and analyze data.
- 'Text 'text type: Used to display text data. At the same time, it supports a variety of styles and formats, such as font size, color, bold, italics, line wrapping, etc., and can also format data to meet different typesetting needs.
- 'Link 'link type: Convert the data into hyperlinke, click the link to jump to the specified web page or file
- 'Image 'image type: Convert valid URLs into image displays such as photos, icons, etc.
- 'Video 'video type: Convert valid URLs into video presentations, such as YouTube videos, local video files, etc.
- 'Sparkline 'miniature type: Turn data into small chart displays, such as line charts, area charts, and display data trends and changes in tables.
- 'Progressbar 'progress bar type: Convert data into progress bar display, customize progress bar color, size and text, and easily display task progress and status in tables.
- 'Chart 'chart type: Convert data into VChart charts and display them in cells.
- Custom rendering: If you want cells to render richer content or layout patterns, you can also do so through custom rendering.
Comprehensive interaction capabilities
VTable provides rich and comprehensive interaction capabilities.
table interaction
Interaction types include: select cells, hover highlighting, drag and drop transposition, sort, freeze columns, adjust column widths, etc.
select cells: 支持单选,框选,选中整列,快捷键多选及全选
hover highlight: 支持hover单元格高亮,或十字高亮
change column: 拖拽表头换位
sort records
frozen column
resize column width
Component Level Interaction
Interaction types include: scroll bar scroll, tooltip prompt, dropdown menu pop-up, etc.
tooltip
dropdown
If the above interaction does not meet the requirements, you can customize the interaction behavior in conjunction with event event listening.
Flexible and diverse UI styles
VTable supports a variety of Themes and styles, which can be customized according to the needs of users to meet different visual effects.
Multiple theme Themes
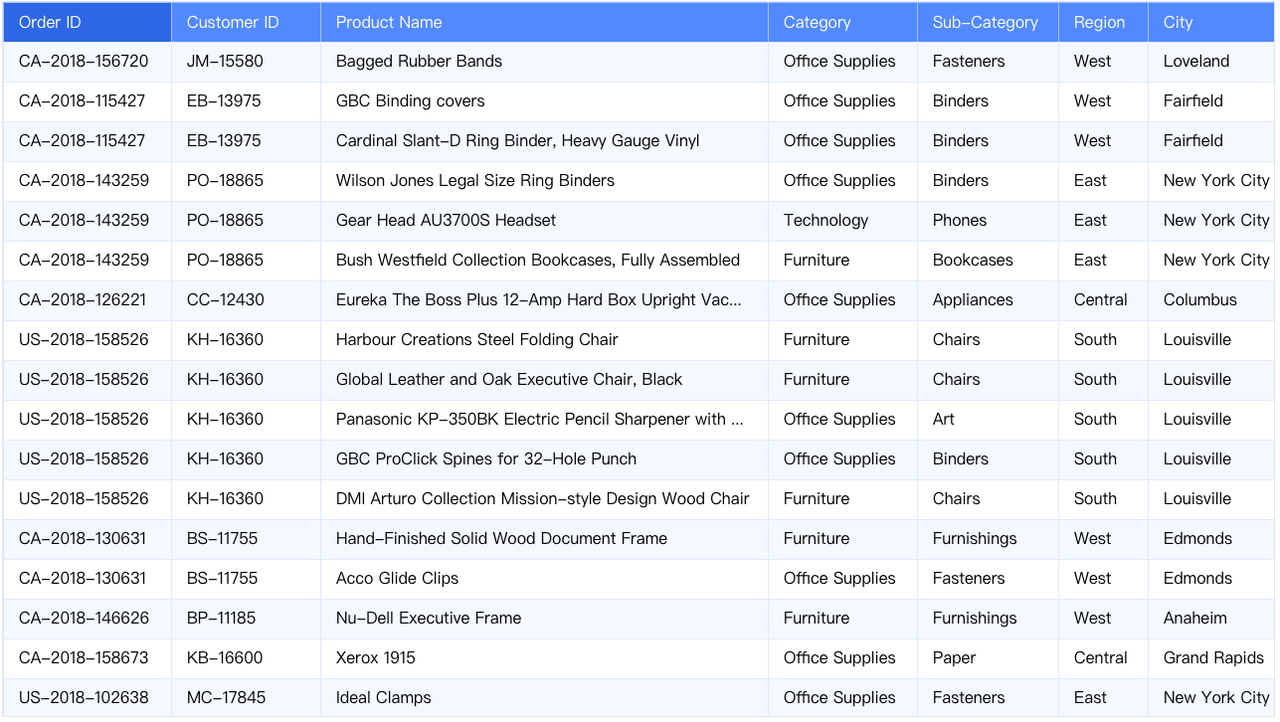
ARCO theme
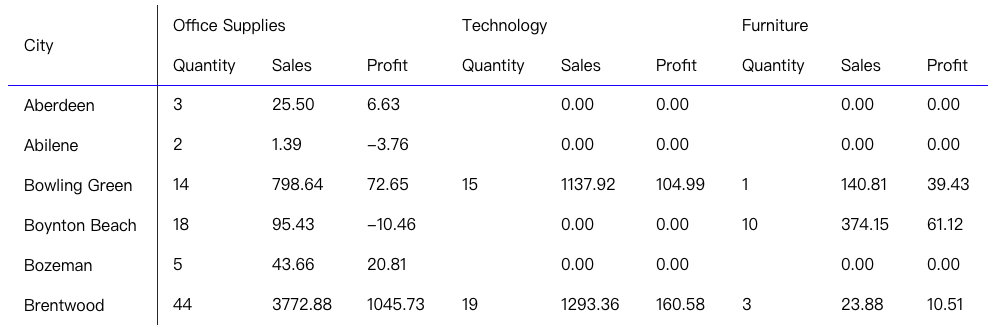
LIGHT theme
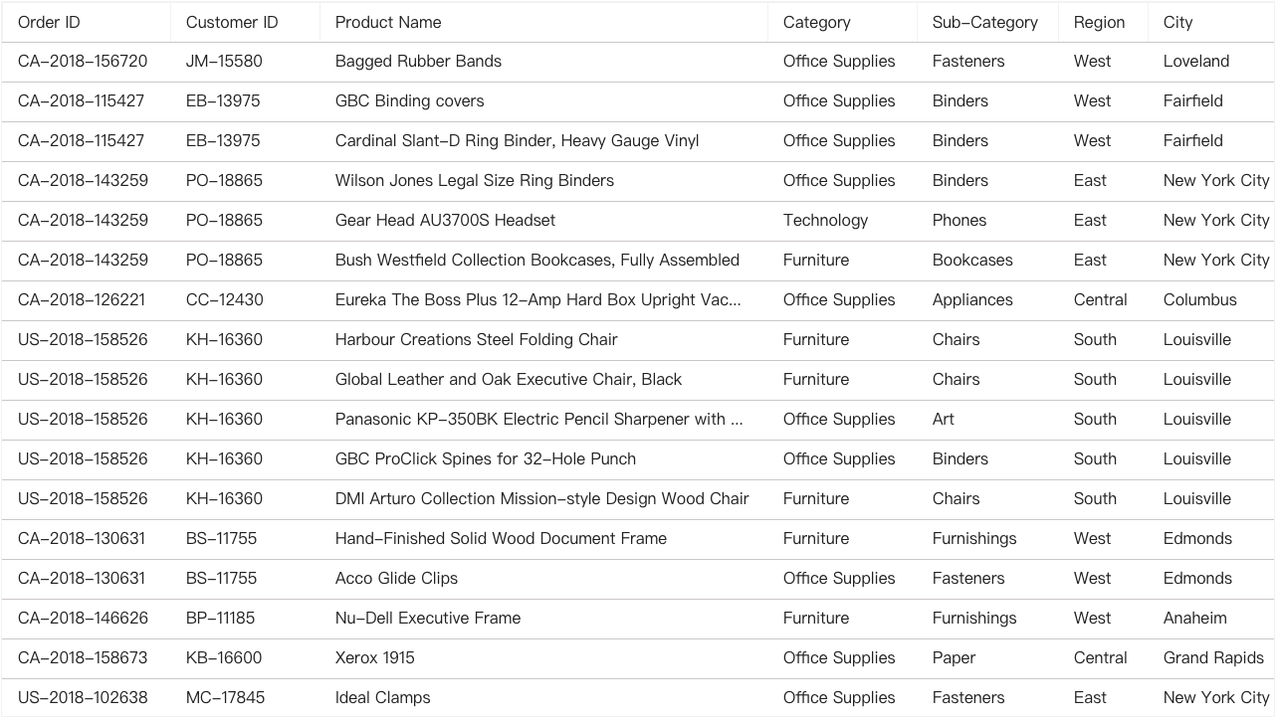
SIMPLY theme
DARK theme
custom
custom
Cell style
In addition to using theme to set styles, cell styles can also be set through the configuration style of column Dimensions or row Dimensions, which can achieve the flexibility of customizing styles at the cell level.
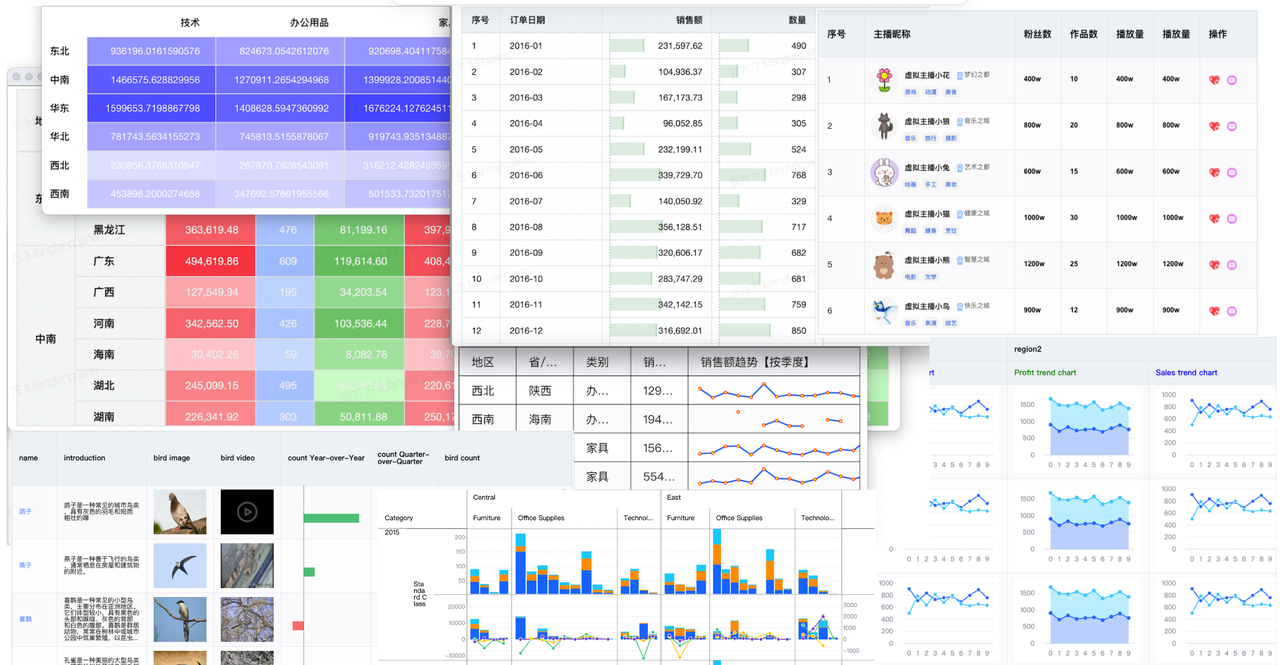
User CASES:
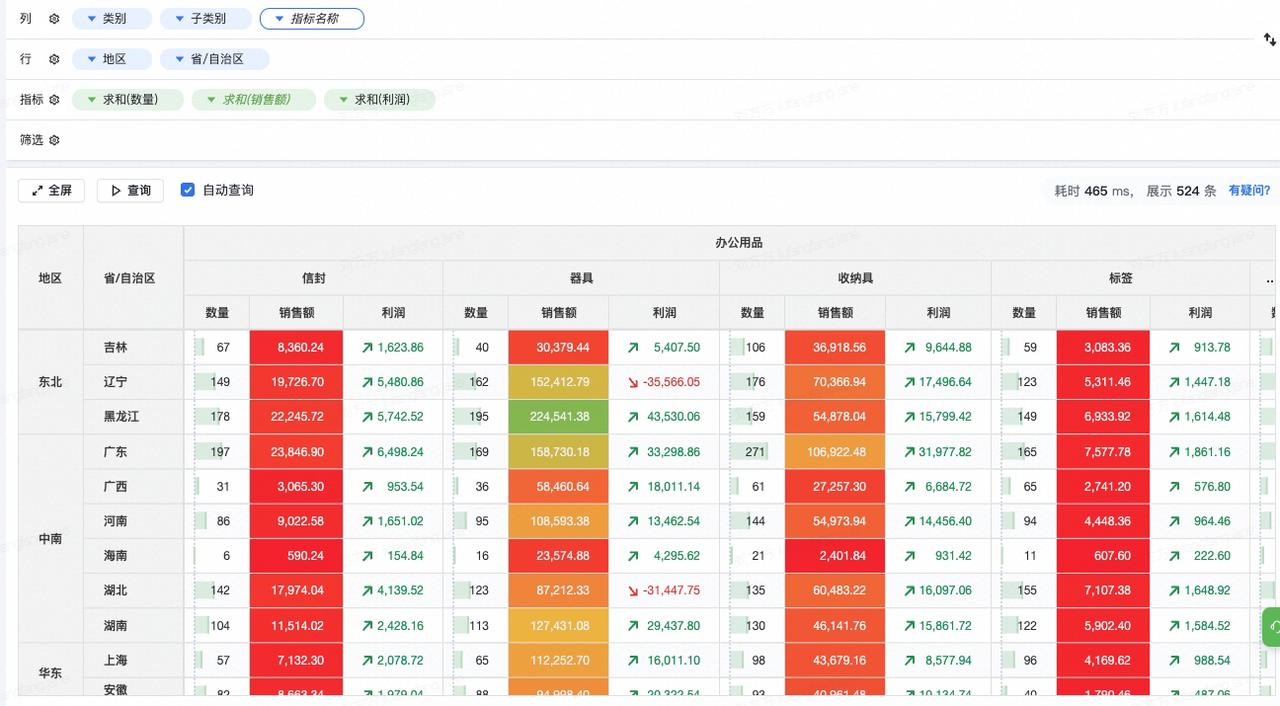
From DataWind
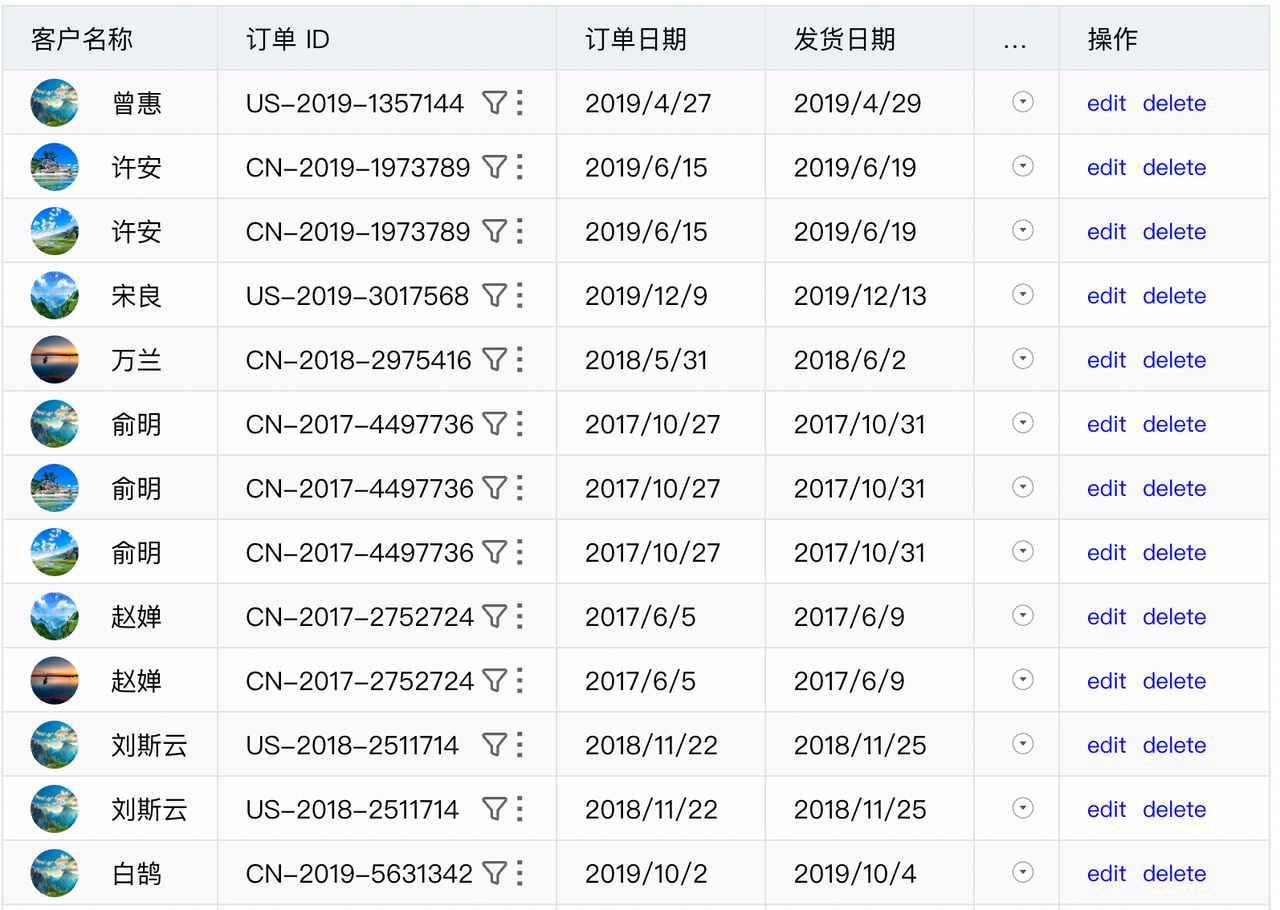
Sales order information
Conclusion
VTable is a high-performance table component library based on the visual rendering engine VRender, providing excellent performance and powerful multi-dimensional analysis capabilities, as well as flexible and powerful graphics capabilities. VTable supports fast calculation and rendering of millions of data, and can automatically analyze and render multi-dimensional data. Seamless integration of VChart provides users with powerful data analytics and visualization capabilities. VTable provides rich functions, including multiple table types, cell content types, interactive functions, Themes, styles, custom rendering, etc., to meet the various needs of users. If you are looking for an efficient and easy-to-use data table library, VTable is a good choice!