
Pivot data analysis
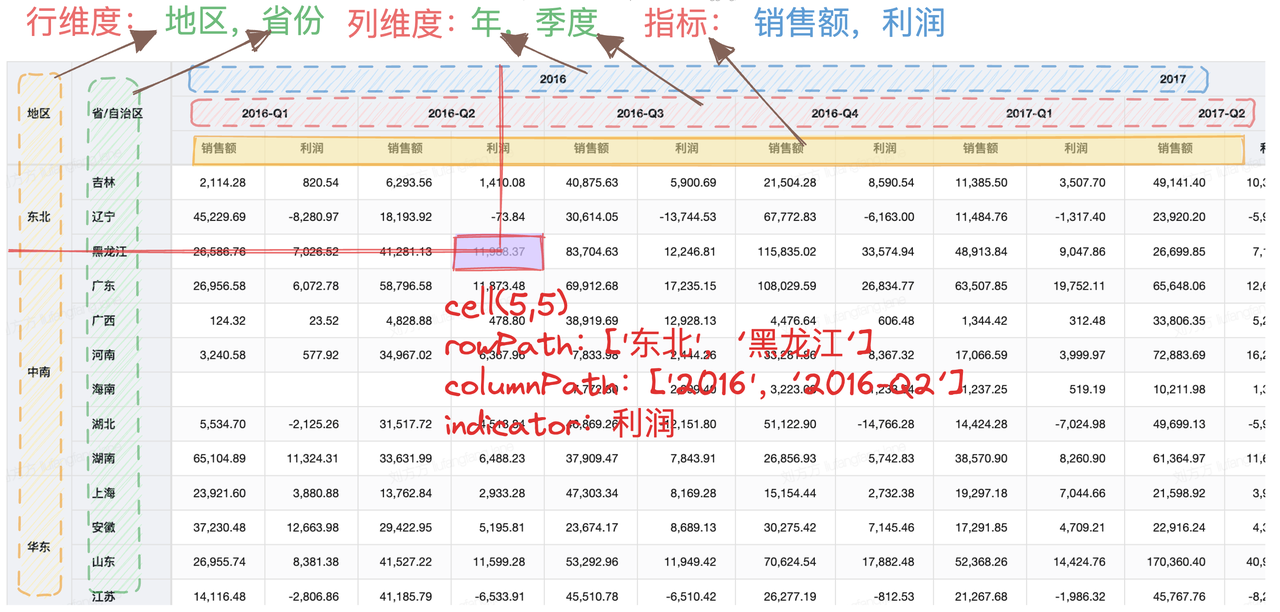
In the figure below, there are four business dimensions: region, province, year, quarter, and indicators: sales, profit.
Pivot table structure description
VTable implements multi-dimensional tables
Concept mapping to configuration items
The configuration of the pivot table above is as follows:
const option={
  rows:['region','province'], //row dimensions
  columns:['year','quarter'], //column dimensions
  indicators:['sales','profit'], //Indicators //Whether to enable data analysis function
  records:[ //Data source。 If summary data is passed in, use user incoming data
    {
      region:'东北',
      province:'黑龙江',
      year:'2016',
      quarter:'2016-Q1',
      sales:1243,
      profit:546
    },
    ...
  ]
}
This configuration is the simplest configuration for multidimensional tables. As the functional requirements become more complex, various configurations can be added for each function point to meet the needs.
Data analysis related configuration:
| Configuration item | Type | Description |
|---|---|---|
| rows | (IRowDimension | string)[] | Row dimension field array, used to parse out the corresponding dimension members |
| columns | (IColumnDimension | string)[] | Column dimension field array, used to parse out the corresponding dimension members |
| indicators | (IIndicator | string)[] | Specific display indicators |
| dataConfig.aggregationRules | aggregationRule[] | Aggregation value calculation rules according to row and column dimensions |
| dataConfig.derivedFieldRules | DerivedFieldRule[] | Derived fields |
| dataConfig.sortRules | sortRule[] | Sort rules |
| dataConfig.filterRules | filterRule[] | Filter Rules |
| dataConfig.totals | totalRule[] | Subtotal or total |
| dataConfig.calculatedFieldRules | CalculateddFieldRule[] | calculated fields |
dataConfig configuration definition:
/**
 * Data processing configuration
 */
export interface IDataConfig {
  aggregationRules?: AggregationRules; //Calculate the aggregated values according to row and column dimensions; by default, all indicator values will be calculated by summing them up.
  sortRules?: SortRules; //排序规则;
  filterRules?: FilterRules; //过滤规则;
  totals?: Totals; //小计或总计;
  derivedFieldRules?: DerivedFieldRules; //派生字段定义
  ...
}
dataConfig application example:
1. Totals
VTable to calculate subtotals configuration:
Configuration example:
dataConfig: {
      totals: {
        row: {
          showGrandTotals: true,
          showSubTotals: true,
          subTotalsDimensions: ['province'],
          grandTotalLabel: 'row total',
          subTotalLabel: 'Subtotal',
          showGrandTotalsOnTop: true, //totals show on top
          showSubTotalsOnTreeNode: false // When subtotals are disabled in pivot tables, this option allows aggregated values to be displayed on collapsed tree nodes. Default value is false.
        },
        column: {
          showGrandTotals: true,
          showSubTotals: true,
          subTotalsDimensions: ['quarter'],
          grandTotalLabel: 'column total',
          subTotalLabel: 'Subtotal',
          showSubTotalsOnTreeNode: false // When subtotals are disabled in pivot tables, this option allows aggregated values to be displayed on collapsed tree nodes. Default value is false.
        }
      }
    },
Online demo:https://visactor.io/vtable/demo/data-analysis/pivot-analysis-total
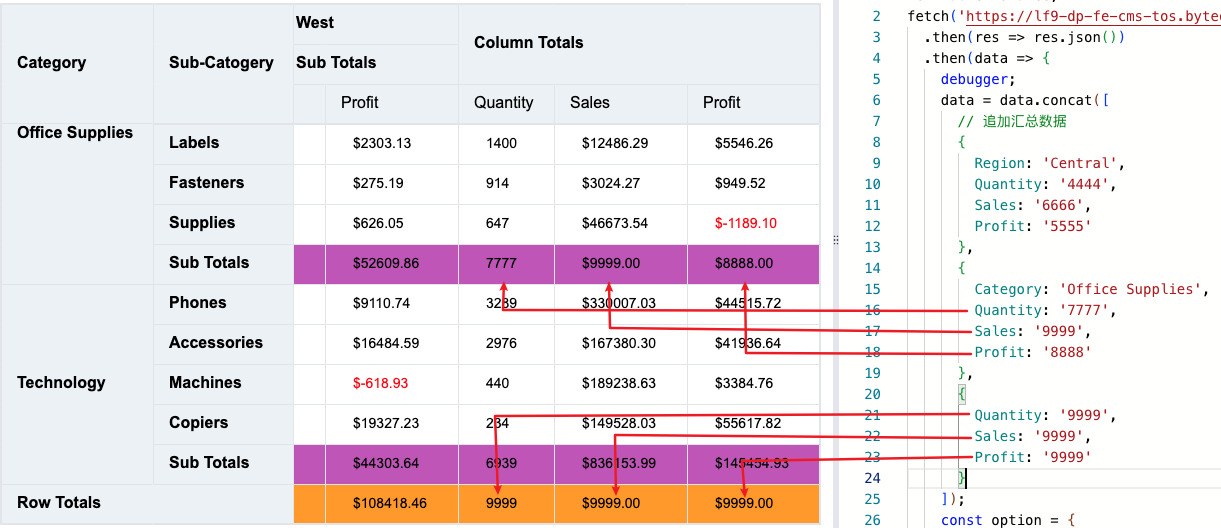
Custom summary data
If you need to customize summary data, you do not want VTable to calculate the subtotals. In addition to the above configuration, you also need to include the corresponding summary data in the data passed to VTable. In this way, VTable will analyze it internally and display it as summary data instead of using VTable's summary value.
Custom subtotal total sample code
Specific example: https://visactor.io/vtable/demo/data-analysis/pivot-analysis-custom-total
2. Sorting rules
VTable's pivot table supports four sorting methods: natural sorting of dimension values, specified dimension value order, indicator value sorting, and custom sorting.
For definitions, please refer to:
option description Usage tutorial
The following is an example of the indicator value sorting configuration:
dataConfig: {
    sortRules: [
        {
          sortField: 'city',
          sortByIndicator: 'sales',
          sortType: VTable.TYPES.SortType.DESC,
          query: ['office supplies', 'pen']
        } as VTable.TYPES.SortByIndicatorRule
      ]
}
If you need to modify the sorting rules of the pivot table, you can use the interface updateSortRules.
Online demo:https://visactor.io/vtable/demo/data-analysis/pivot-analysis-sort-dimension
3. Filter rules
Configuration example:
dataConfig: {
  filterRules: [
        {
          filterFunc: (record: Record<string, any>) => {
            return record.province !== 'Sichuan Province' || record.category !== 'Furniture';
          }
        }
      ]
}
Online demo:https://visactor.io/vtable/demo/data-analysis/pivot-analysis-filter
4. Aggregation method
By default, all indicator values are calculated in the SUM way. If you don't want this default calculation method, you can modify it by configuring aggregationRules.
In general, indicators should be of type number so that internal calculations can be performed.
If the indicator is a string type or null, and needs to be displayed in the cell, you can configure aggregationType as VTable.TYPES.AggregationType.NONE to display the original value of the data source field; or you can use the getCellOriginRecord interface in the indicator format function to obtain the data source entry corresponding to the cell, and then perform special processing.
If you use custom rendering customLayout and want to get all the data records corresponding to the cell in the customLayout function, you can configure aggregationType as VTable.TYPES.AggregationType.RECORD.
Configuration example:
dataConfig: {
    aggregationRules: [
        //The basis for doing aggregate calculations, such as sales. If there is no configuration, the cell content will be displayed by default based on the aggregate sum calculation result.
        {
          indicatorKey: 'TotalSales', //Indicator name
          field: 'Sales', //Indicator based on field
          aggregationType: VTable.TYPES.AggregationType.SUM, //Calculation type
          formatFun: sumNumberFormat
        },
        {
          indicatorKey: 'OrderCount', //Indicator name
          field: 'Sales', //Indicator based on field
          aggregationType: VTable.TYPES.AggregationType.COUNT, //Computation type
          formatFun: countNumberFormat
        },
        {
          indicatorKey: 'AverageOrderSales', //Indicator name
          field: 'Sales', //Indicator based on field
          aggregationType: VTable.TYPES.AggregationType.AVG, //Computation type
        },
        {
          indicatorKey: 'MaxOrderSales', //Indicator name
          field: 'Sales', //Indicator based on field
          aggregationType: VTable.TYPES.AggregationType.MAX, //Computation type , caculate max value
        },
        {
          indicatorKey: 'OrderSalesValue', //Indicator name
          field: 'Sales', //Indicator based on field
          aggregationType: VTable.TYPES.AggregationType.NONE, //don't aggregate
        },
        {
          indicatorKey: 'orderRecords', //Indicator name
          field: 'Sales', //Indicator based on field
          aggregationType: VTable.TYPES.AggregationType.RECORD, //don't aggregate. Match all the corresponding data as the value of the cell
        },
        {
          indicatorKey: 'Custom Aggregation Function', //Indicator name
          field: 'sales', //Indicator based field
          aggregationType: VTable.TYPES.AggregationType.CUSTOM, //Custom aggregation type requires configuration of custom function aggregationFun
          aggregationFun(values, records) {
            return values.reduce((pre, cur) => pre + cur, 0) / values.length;
          }
        },
        {
          indicatorKey: 'Average Product Price (Registered Aggregation Class)', //Indicator name
          field: 'sales', //Indicator based field
          aggregationType: 'avgPrice', //Registered aggregation type
        }
      ]
}
Online demo:https://visactor.io/vtable/demo/data-analysis/pivot-analysis-aggregation
特殊聚合类型使用说明
Special Note:
- AggregationType.NONE The usage scenario of the indicator without aggregation is mainly used to display the original data obtained according to the data record input by the user, such as:
records:[{
  region: 'Central South',
  province: 'Guangxi',
  year: '2016',
  quarter: '2016-Q1',
  sales: 'NULL',
  profit: 1546
}],
dataConfig:{
  aggregationRules:[
  {
    indicatorKey: 'sales', //Indicator name
    field: 'sales', //Indicator based field
    aggregationType: VTable.TYPES.AggregationType.NONE, //Do not perform aggregation. Match the corresponding data to obtain the value of the corresponding field.
  }]
}
In this data record, the sales indicator is a non-numeric value. If the product requirement is to directly display "NULL" in the table cell, then the aggregation rule can be set to VTable.TYPES.AggregationType.NONE, so that VTable's internal will not perform aggregation calculations, but directly take the sales field value as the display value of the cell.
- AggregationType.RECORD usage scenario is mainly used to match all data based on the user's input data record and use it as the display data of the cell. Usage scenarios include: needing to collect data sets for mini-chart displays, specific demo see: https://visactor.io/vtable/demo/cell-type/pivot-sparkline
Custom Aggregation Type Introduction
To declare a custom aggregation class, you need to inherit the internal type VTable.TYPES.Aggregator, and then register it to VTable through VTable.register.aggregator.
Here is an example of a custom aggregation class:
// Implement a custom aggregation type to calculate the average product price
class AvgPriceAggregator extends VTable.TYPES.Aggregator {
  sales_sum: number = 0;
  number_sum: number = 0;
  constructor(config: { key: string; field: string; formatFun?: any }) {
    super(config);
    this.key = config.key;
    this.formatFun = config.formatFun;
  }
  push(record: any): void {
    if (record) {
      if (record.isAggregator) {
        this.records.push(...record.records);
      } else {
        this.records.push(record);
      }

      if (record.isAggregator) {
        this.sales_sum += record.sales_sum;
        this.number_sum += record.number_sum;
      } else {
        record.sales && (this.sales_sum += parseFloat(record.sales));
        record.number && (this.number_sum += parseFloat(record.number));
      }
    }
    this.clearCacheValue();
  }
  deleteRecord: (record: any) => void;
  updateRecord: (oldRecord: any, newRecord: any) => void;
  recalculate: () => any;
  clearCacheValue() {
    this._formatedValue = undefined;
  }
  value() {
    return this.records?.length >= 1 ? this.sales_sum / this.number_sum : undefined;
  }
  reset() {
    super.reset();
    this.sales_sum = 0;
    this.number_sum = 0;
  }
}
// Register the aggregation type to VTable
VTable.register.aggregator('avgPrice', AvgPriceAggregator);
// Usage after registration, in dataConfig.aggregationRules, configure aggregationType as `avgPrice`.
const option={
  ...
  dataConfig: {
    aggregationRules: [
        {
          indicatorKey: 'Average Product Price (Registered Aggregation Class)', //Indicator name
          field: 'sales', //Indicator based field
          aggregationType: 'avgPrice', //Registered aggregation type
        }
      ]
  }
}
VTable's internal aggregation rules code address: https://github.com/VisActor/VTable/blob/develop/packages/vtable/src/ts-types/dataset/aggregation.ts, can be referred to!
The methods that need to be implemented for the aggregation type are:
- constructor: The constructor function, used to initialize the aggregator.
- push: Add data records to the aggregator, used to calculate the aggregated value.
- deleteRecord: Delete records from the aggregator and update the aggregated value, called by VTable's delete interface deleteRecords.
- updateRecord: Update data records and update the aggregated value, called by the updateRecords interface.
- recalculate: Recalculate the aggregated value, currently called by the method of copying and pasting cell values.
- value: Get the aggregated value.
- reset: Reset the aggregator.
If you feel that methods that do not need to be implemented can be written as empty functions.
5. Derive Field
Configuration example:
dataConfig: {
    derivedFieldRules: [
      {
        fieldName: 'Year',
        derivedFunc: VTable.DataStatistics.dateFormat('Order Date', '%y', true),
      },
      {
        fieldName: 'Month',
        derivedFunc: VTable.DataStatistics.dateFormat('Order Date', '%n', true),
      }
    ]
}
Online demo:https://visactor.io/vtable/demo/data-analysis/pivot-analysis-derivedField
6. Pivot table calculated fields
Configuration example:
dataConfig: {
  calculatedFieldRules:[
    {
      key: 'AvgPrice',
      dependIndicatorKeys: ['Quantity', 'Sales'],
      calculateFun: dependValue => {
        return dependValue.Sales / dependValue.Quantity;
      }
    }
  ],
}
Configuration explanation:
- key: The key unique identifier of the calculated field, which can be used as a new indicator and configured in indicators for display in the pivot table.
- dependIndicatorKeys: The indicators that the calculated field depends on, which can be the corresponding indicator fields in records. If the dependent indicator is not in records, it needs to be configured in aggregationRules, specifying the aggregation rules and indicatorKey to be used in dependIndicatorKeys.
- calculateFun: the calculation function of the calculated field, the function parameter is the value of the dependent indicator.
Specific example: https://visactor.io/vtable/demo/data-analysis/pivot-analysis-calculatedField
Data analysis process
Dependent configuration: dimensions, indicators and dataConfig.
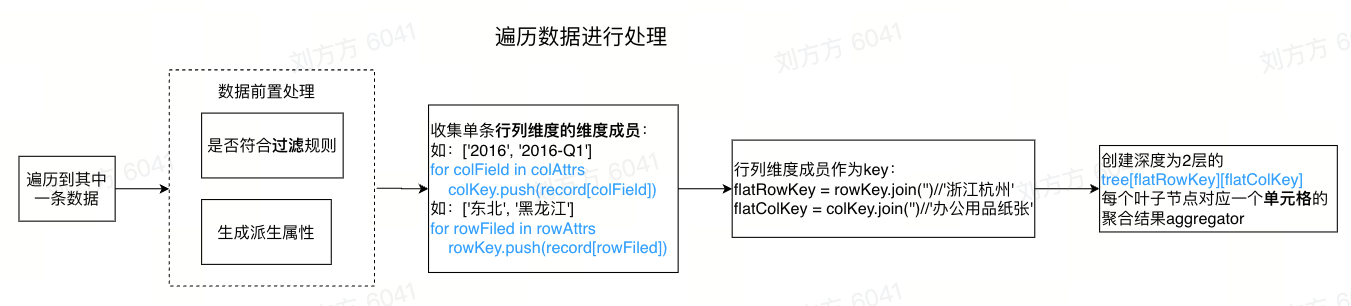
The process of traversing data:
Traverse the records once, parse the row header dimension value to display the header cell, distribute all data in the records to the corresponding row and column path set, and calculate the aggregate value of the body part indicator cell.
Data analysis process
Data dimension tree
According to the above traversed structure, a dimension tree will be generated, from which the value of the cell and the original data entry of the value can be found.
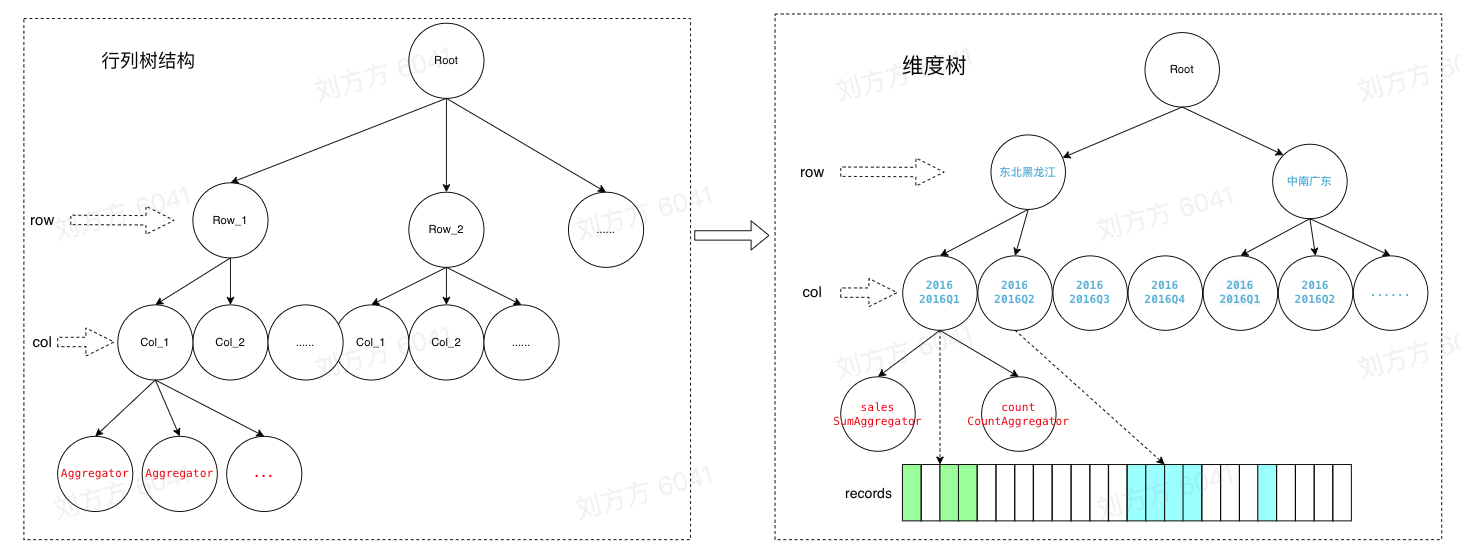
Organize dimension tree to aggregate data
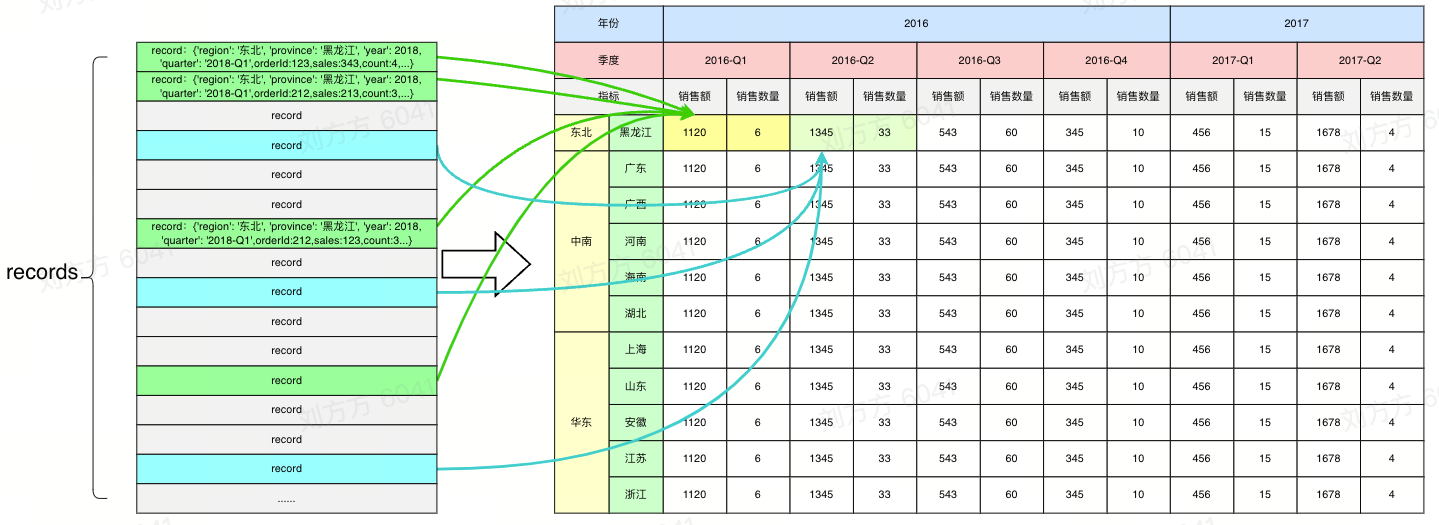
Correspondence between data source entries and cells
Custom header structure width dimension tree
Although multi-dimensional tables with analytical capabilities can automatically analyze the dimension values of each dimension to form a tree structure of row and column headers, and can be sorted according to dataConfig.sortRules, scenarios with complex business logic still expect to be able to **customize Row column header dimension value ** and order. Then these business requirement scenarios can be realized through rowTree and columnTree.
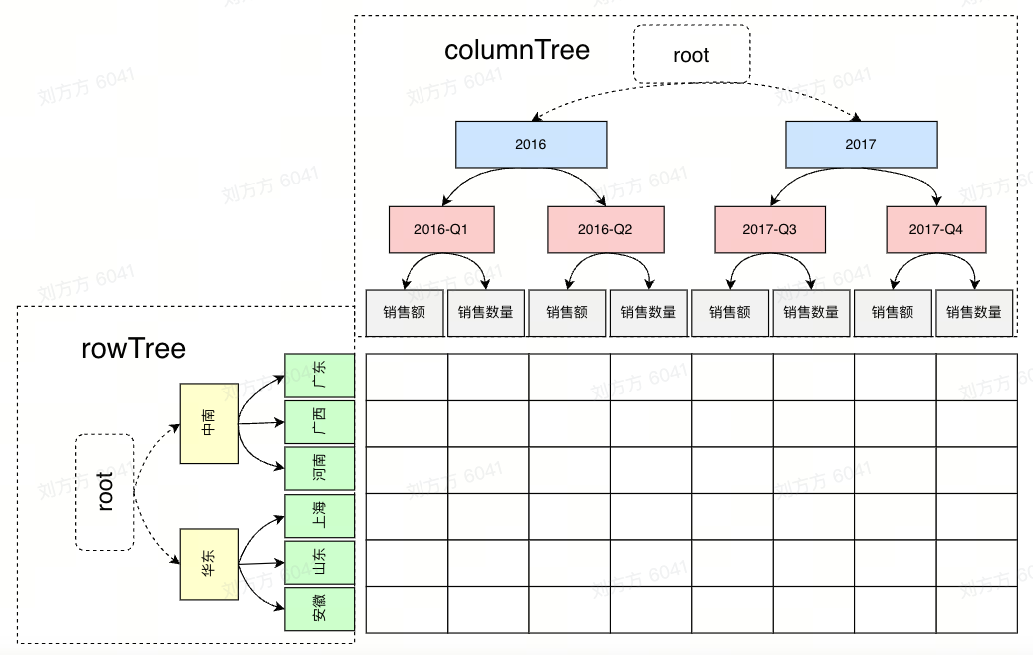
custom rowTree columnTree
Custom tree configuration:
const option = {
    rowTree: [{
        dimensionKey: 'region',
        value: '中南',
        children: [
            {
                dimensionKey: 'province',
                value: '广东',
            },
            {
                dimensionKey: 'province',
                value: '广西',
            }
        ]
    },
    {
        dimensionKey: 'region',
        value: '华东',
        children: [
            {
                dimensionKey: 'province',
                value: '上海',
            },
            {
                dimensionKey: 'province',
                value: '山东',
            }
        ]
    }],
    columnTree: [{
        dimensionKey: 'year',
        value: '2016',
        children: [
            {
                dimensionKey: 'quarter',
                value: '2016-Q1',
                children: [
                    {
                        indicatorKey: 'sales',
                        value: 'sales'
                    },
                    {
                        indicatorKey: 'profit',
                        value: 'profit'
                    }
                ]
            },
            {
                dimensionKey: 'quarter',
                value: '2016-Q2',
                children: [
                    {
                        indicatorKey: 'sales',
                        value: 'sales'
                    },
                    {
                        indicatorKey: 'profit',
                        value: 'profit'
                    }
                ]
            }
        ]
    }],
    indicators: ['sales', 'profit'],

    corner: {
        titleOnDimension: 'none'
    },
    records: [
        {
            region: '中南',
            province: '广东',
            year: '2016',
            quarter: '2016-Q1',
            sales: 1243,
            profit: 546
        },
        {
            region: '中南',
            province: '广东',
            year: '2016',
            quarter: '2016-Q2',
            sales: 2243,
            profit: 169
        }, {
            region: '中南',
            province: '广西',
            year: '2016',
            quarter: '2016-Q1',
            sales: 3043,
            profit: 1546
        },
        {
            region: '中南',
            province: '广西',
            year: '2016',
            quarter: '2016-Q2',
            sales: 1463,
            profit: 609
        },
        {
            region: '华东',
            province: '上海',
            year: '2016',
            quarter: '2016-Q1',
            sales: 4003,
            profit: 1045
        },
        {
            region: '华东',
            province: '上海',
            year: '2016',
            quarter: '2016-Q2',
            sales: 5243,
            profit: 3169
        }, {
            region: '华东',
            province: '山东',
            year: '2016',
            quarter: '2016-Q1',
            sales: 4543,
            profit: 3456
        },
        {
            region: '华东',
            province: '山东',
            year: '2016',
            quarter: '2016-Q2',
            sales: 6563,
            profit: 3409
        }
    ]
};
VTable official website example: https://visactor.io/vtable/demo/table-type/pivot-table.
The complexity of the custom tree lies in the formation of the row, column and dimension trees. You can choose to use it according to the business scenario. If you have complex sorting, aggregation or paging rules, you can choose to use a custom method.
Other related configurations
Drilling up and down
We only provide the display of the drill-down download button. If you need this capability, you need to combine events and interfaces to implement the relevant logic yourself.
Add the drillDown configuration item to the dimension configuration rows or columns to display the download button, listen to the icon button click event drillmenu_click, determine whether to drill down or roll up the dimension according to the event parameter drillDown or drillUp, determine the dimension to drill down or drill up according to the parameter dimensionKey, add or delete it to rows or columns, obtain the data source corresponding to the new dimension level, and call the interface updateOption to update the new option to the table.
Specific demo: https://visactor.io/vtable/demo/data-analysis/pivot-analysis-table-drill
Related interfaces
getCellOriginRecord
It can help to obtain the original data entry corresponding to the cell aggregate value.
updateFilterRules
Update data filtering rules.
Interface definition:
/**
 * Update data filtering rules
 * @param filterRules Filter rules
 * @param isResetTree Whether to reset the table header tree structure. When true, the table header tree structure will be reset, when false, the table header tree structure will remain unchanged
 */
updateFilterRules(filterRules: FilterRules, isResetTree: boolean = false) => void