
Custom Rendering
In the field of data analysis, to present data more intuitively, we often use charts or grids. In some specific scenarios, we wish to add more expressive and personalized display effects to certain cells of a table. At this time, the custom rendering function of table cell content becomes particularly important. Through custom rendering of cell content, we can achieve the following types of scenario needs:
-
Rich text display. Display text with various styles and layouts within a cell, making it easy for users to quickly grasp key information.
-
Mixed text and image display. Display images or icons in cells according to data, making the data more intuitive.
-
Graphical data display. Display data in a graphical way, such as circles, rectangles, etc., making data comparison and analysis more intuitive.
-
Custom cell layout. Arrange custom rendering elements in any layout within a cell to meet special layout needs.
In the VTable library, we can achieve the above scenario needs by defining custom rendering of table cell content. Because it is more flexible, it can be customized according to business data, but the cost to the integrator is also higher, requiring their own calculation of positions, etc. (While drawing custom content, if you want to draw the default content according to the internal logic of VTable, please set renderDefault to true.)
Case Analysis
Next, we will explain the implementation process using the effect shown in the following figure as an example.
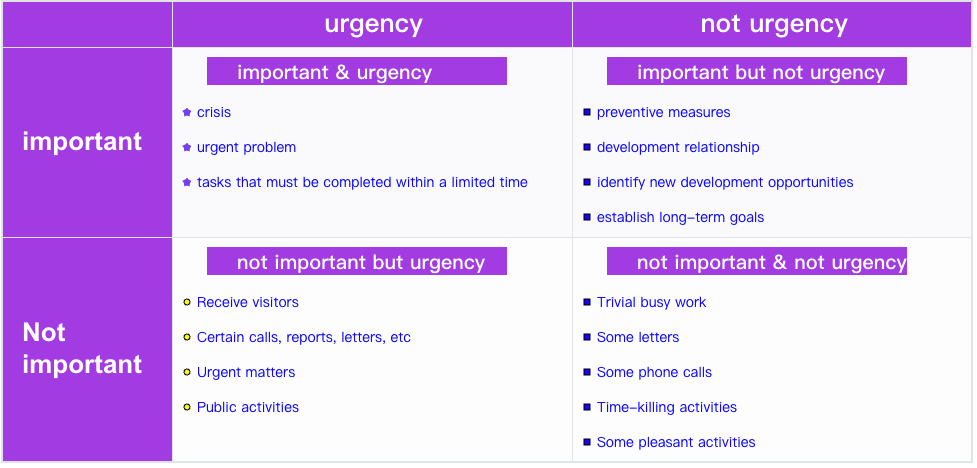
Preparing Data:
The body data cell part of the table in the figure above has two rows, corresponding to the two pieces of data in our records.
    records:[
      {
        'type': 'important',
        "urgency": ['crisis','urgent problem','tasks that must be completed within a limited time'],
        "not_urgency": ['preventive measures','development relationship','identify new development opportunities','establish long-term goals'],
      },
      {
        'type': 'Not\nimportant',
        "urgency": ['Receive visitors','Certain calls, reports, letters, etc','Urgent matters','Public activities'],
        "not_urgency": ['Trivial busy work','Some letters','Some phone calls','Time-killing activities','Some pleasant activities'],
      },
    ],
Content Decomposition
Let's analyze the composition of each cell's display content:
- Title
- List of items
- Title background rectangle
- List symbols (circle, rectangle, star)
Therefore, we need to use a variety of custom elements:
- The title corresponds to the text type
- The text part of the item list uses text
- The title background rectangle uses rect element
- List symbols (circle, rectangle, star) correspond to circle, rect, icon types respectively
How to Use Custom Rendering Interface
In VTable, we can define custom rendering in the following two ways:
customRenderfor global custom rendering settings, recommended if the layout of each column is basically consistent;columns.customRenderfor column-specific custom rendering, recommended if the layout of each column is different;
The configuration content supports two forms:
- Object form
- Function form, which can return different results combined with business logic
For specific parameter descriptions, refer to the API documentation customRender
From the example effect diagram above, it can be seen that the layouts of the urgency and not urgency columns are consistent, so here I adopt the global setting method.
Custom Rendering for Header Cells
To customize the rendering of header cells, you can use columns.headerCustomRender. Its usage is similar to columns.customRender.
Custom Rendering for Body Cells
The demo mentioned above, customRender, is for custom rendering of body cells.
Auto Layout Usage
In some scenarios, we want the custom-rendered elements to automatically layout to fit the cell size. Or, if you prefer to layout in a more flexible way, using an approach closer to html/react for coding, then you can refer to the tutorial Custom Rendering Auto Layout.