Visual mapping is the bridge between data and images, mapping the "data model" to the "image model" and selecting suitable visual variables for different types of data. For example, if we use a bar chart to represent the average scores of boys and girls in a class, we can map the gender attribute in the data to the color attribute in the image, and map the score attribute in the data to the height (Y-axis coordinate) attribute of the bar chart in the image. Below, we analyze how data is mapped to the final image through a simple use case.
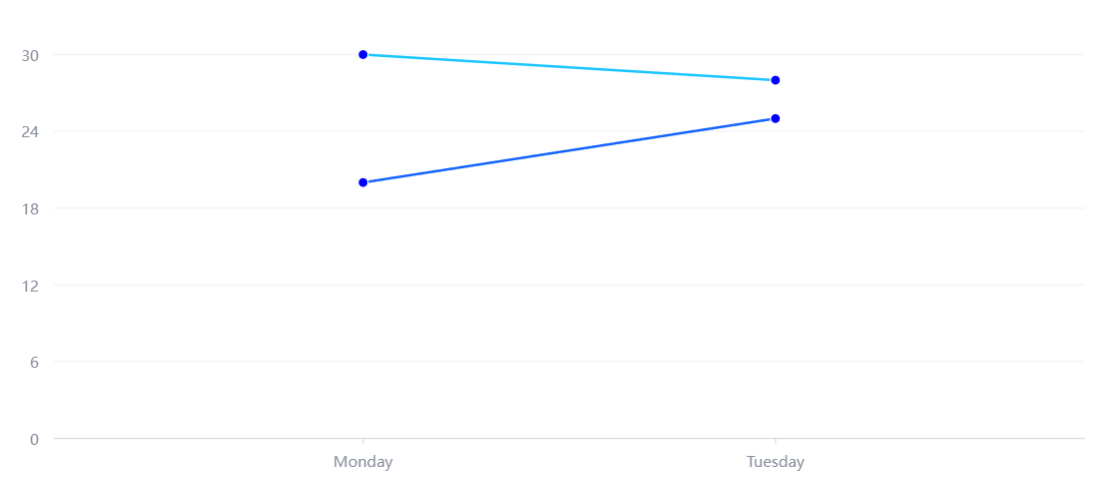
This example creates a line type glyph series to display 4 data points, where points with the same class attribute will be connected into a line. The date attribute is mapped to the X-axis coordinate, and the score attribute is mapped to the Y-axis coordinate. The effect is as follows:
Creation of Primitives
Below we analyze through code how renderSync() parses the configuration spec and generates various primitives on the graph. Overall, renderSync() includes the following three stages: pre-rendering, rendering, and post-rendering.
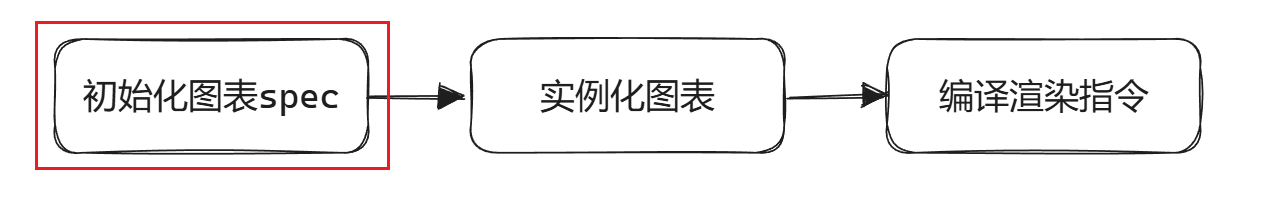
The rendering process belongs to the domain of VGrammar, and after rendering, the main focus is on updating the animation state. We mainly focus on the pre-render preparation related to the graphics, including initializing chart configurations, instantiating charts, and compiling rendering instructions.
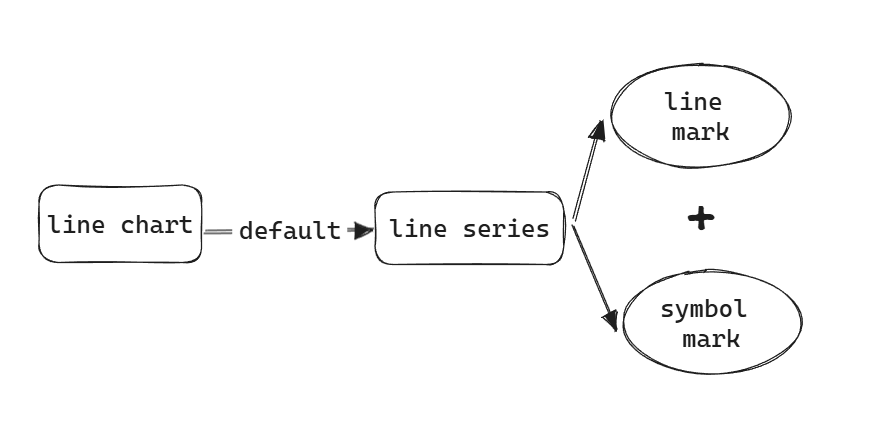
First, replace the function name registered by the user with the corresponding function entity. Then, according to the chart type, create the corresponding chart configuration converter to convert the configuration of this type of chart into the configuration of the common type chart. This includes creating a default series based on the chart type and completing the user-defined series configuration:
Next, create a chart object of the corresponding type. The chart object here does not refer to the VChart object created below. VChart encapsulates the chart, serving as the entry point for user operations, responsible for global management and external interfaces of the chart;
const vchart = new VChart(spec, { dom: CONTAINER_ID });
The instantiated chart here is responsible for the specific chart construction (such as creating and managing series, components) and internal logic processing (managing data flow, global mapping, graphic element states, etc.).
The core steps are created and init, the former creates various elements according to spec, such as region, series, components, and the latter initializes each element. We focus on the graphic elements in the creation of series.
It was found that indeed the line primitives and symbol primitives continued to be created:
After a series of function calls (LineLikeSeriesMixin.initLineMark -> BaseSeries._createMark -> BaseModel._createMark -> Factory.createMark), it finally reaches the constructor of the corresponding graphic element, which is the "implementation of specific graphic elements" mentioned earlier.
3. Compile Rendering Instructions
Compile various VChart models (region, series, component) into renderable VGrammar syntax elements, involving the content of the VGrammar syntax layer, which will not be analyzed in detail.
Mapping of Graphic Element Visual Configuration
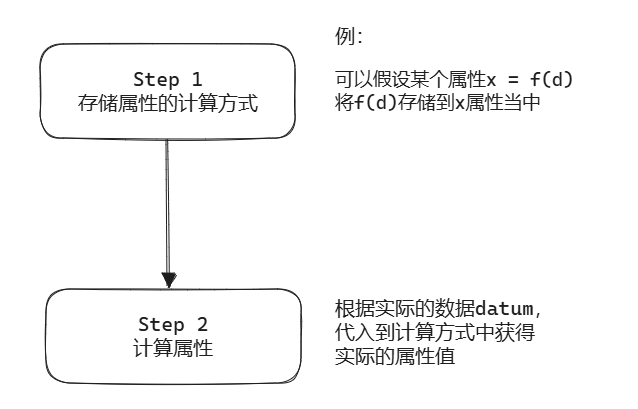
In the BaseMark class, graphic elements achieve the mapping from data to visual channels through a series of methods and logic. This can be roughly divided into two processes: the storage of attributes and the calculation of attribute values. The former simply parses the user-defined spec and stores it in the style sheets of various states of the graphic element, during which some simple conversions are made; the latter is where the user of the graphic element truly obtains and calculates specific attribute values when laying out the graphic element.
Step1 Store Style
1. Initialize Style
Initialize the default style of the graphic element, call the setStyle method to set the default value for the normal state:
Default styles include visible: true, x: 0, y: 0, etc.
These default values ensure that the elements render correctly even without user-defined styles.
The initStyleWithSpec method initializes styles based on the user-provided spec:
initStyleWithSpec(spec: IMarkSpec<T>, key?: string) {
  if (!spec) return;

  if (isValid(spec.id)) this._userId = spec.id;
  if (isBoolean(spec.interactive)) this._markConfig.interactive = spec.interactive;
  if (isValid(spec.zIndex)) this._markConfig.zIndex = spec.zIndex;
  if (isBoolean(spec.visible)) this.setVisible(spec.visible);

  this._initSpecStyle(spec, this.stateStyle, key);
}
Parse user-defined attributes such as interactive, zIndex, visible, etc.
Call the _initSpecStyle method to handle style and state. This part mainly involves calling setStyle to set the corresponding style for each state (including the initial normal state) and storing the state information in the state manager. We explain the state in detail.
The above methods all call the core function setStyle, which is used to set styles for specified states:
The _filterAttribute called in setStyle is used to filter and transform individual style attributes, ensuring that the style attributes conform to internal usage standards. These transformations are relatively simple, as noted in the comments.
It is particularly important to note that in styleConvert, some styles that need to be converted to scale type are transformed for subsequent attribute value calculations. For example, convert yField: 'score' to:
This is a scale type style, where the first field scale calculates the value of the data corresponding field datum['score'] as the y coordinate of the graphic element.
Step2 Calculate Attribute Values
BaseMark provides an interface getAttribute for its users to calculate and obtain attribute values based on actual data.
Here, the compteAttribute(key, state) returns a function for calculating an attribute, where key is the attribute name and state is the current state; (datum, opt) is used as the parameter for this function, returning the calculation result, consistent with our above description of “the method of storing attribute calculations”.
Continuing to delve into computeStateAttribute, you will find that an attribute calculation function is constructed here. The input of this function is (datum, opt), and the output is the calculated attribute value. If the attribute value is a constant (unrelated to the data, fixed on spec), then this constructed function directly returns style; what really needs to be calculated are some complex styles and mappings from data to visuals~~(recycling theme)~~.
  protected ***_computeStateAttribute***<U extends keyof T>(stateStyle: any, key: U, state: StateValueType) {
    if (!stateStyle) { // 处理空样式
      return (datum: Datum, opt: IAttributeOpt) => undefined as any;
    }
    if (stateStyle.referer) { // 处理引用样式
      return stateStyle.referer.***_computeAttribute***(key, state);
    }
    if (!stateStyle.style) { // 处理空样式
      return (datum: Datum, opt: IAttributeOpt) => stateStyle.style;
    }
    // =====================================================================
    // **处理函数样式**:如果 stateStyle.style 是函数,调用该函数计算属性值。
    if (typeof stateStyle.style === *'function'*) {
      return (datum: Datum, opt: IAttributeOpt) =>
        stateStyle.***style***(datum, this._attributeContext, opt, this.***getDataView***());
    }
    // **渐变色处理**,支持各个属性回调
    if (GradientType.***includes***(stateStyle.style.gradient)) {
      return this.***_computeGradientAttr***(stateStyle.style);
    }
    // **内外描边处理**,支持各个属性回调
    if ([*'outerBorder'*, *'innerBorder'*].***includes***(key as string)) {
      return this.***_computeBorderAttr***(stateStyle.style);
    }
    // **处理映射样式**:如果 stateStyle.style 包含映射关系(scale),根据数据字段映射值。
    if (***isValidScaleType***(stateStyle.style.scale?.type)) {
      return (datum: Datum, opt: IAttributeOpt) => {
        let data = datum;
        if (this.model.modelType === *'series'* && (this.model as ISeries).***getMarkData***) {
          data = (this.model as ISeries).***getMarkData***(datum);
        }
        return stateStyle.style.scale.***scale***(data[stateStyle.style.field]);
      };
    }
    // =====================================================================
    // **处理常量样式**:如果 stateStyle.style 是常量值,直接返回该值。
    return (datum: Datum, opt: IAttributeOpt) => {
      return stateStyle.style;
    };
  }
Emphasize the scale style, which includes the data-to-visual mapping part. Continuing with the above example, we have already constructed a scale style:
If we need to calculate the y coordinate of the graphic element, first obtain the data bound to the graphic element (see Chapter 5 VChart Data Processing), and then use the scale mapping object to input data['score'] to get the corresponding y value. For more information about scale, see Chapter 7 VChart Scale.
This document was revised and organized by the following personnel