!!!###!!!title=React VChart Introduction——VisActor/VChart Contributing Documents!!!###!!!!!!###!!!description=---title: 14.1.1 Introduction to React-VChart key words: VisActor,VChart,VTable,VStrory,VMind,VGrammar,VRender,Visualization,Chart,Data,Table,Graph,Gis,LLM---!!!###!!!

Overview

react-vchart is the React wrapper version of VChart, mainly providing two styles of components externally:

  • <VChart /> and <VChartSimple />

  • <LineChart /> and other semantic tags

Their differences are as follows:

  • Applicable Scenarios:

  • <VChart />: A large and comprehensive unified entry tag that encapsulates chart specifications, providing standardized update and unload logic. Suitable for toB pages, product pages with page building, and business parties migrating with self-encapsulated VChart.

  • Semantic tags: Suitable for simple pages, where developers write code manually, making it easy to implement unpacking and on-demand loading.

  • Usage:

  • <VChart />: Receives a complete spec as the chart definition. When using, introduce the VChart component and pass in spec and other related attributes. For example:

import { VChart } from '@visactor/react-vchart';
// 假设已经有了 spec 图表描述信息
const spec = {
    // 图表定义相关内容
};
const App = () => {
    return (
        <VChart
            spec={spec}
            // 其他属性如 optionsonReady        />
    );
};
export default App;    

  • Syntax tags: Encapsulate the chart container and each component as React components for export. Choose the corresponding chart tag according to the chart type when using, and then match it with the appropriate component tags and series tags. For example, to create a bar chart: \r\n\r
import React, { useRef } from'react';
import { BarChart, Bar, Legend, Axis } from '@visactor/react-vchart';
const App = () => {
    const chartRef = useRef(null);
    const handleChartClick = () => {
        console.log('图表被点击了');
    };
    const barData = [
        { type: 'Autocracies', year: '1930', value: 129 },
        // 其他数据项
    ];
    return (
        <div>
            <BarChart
                ref={chartRef}
                data={[{ id: 'id0', values: barData }]}
                onClick={handleChartClick}
            >
                <Bar
                    seriesField="type"
                    xField={['year', 'type']}
                    yField="value"
                    bar={{
                        style: {
                            stroke: '#000',
                            strokeWidth: 1
                        },
                        state: {
                            hover: {
                                stroke: 'black'
                            }
                        }
                    }}
                />
                <Axis orient="bottom" type="band" />
                <Axis orient="left" max={200} type="linear" />
                <Legend visible={true} position="start" orient="top" padding={{ bottom: 12 }} />
            </BarChart>
        </div>
    );
};
export default App;    

Through the above code examples, the differences in usage between the two components can be understood more intuitively.

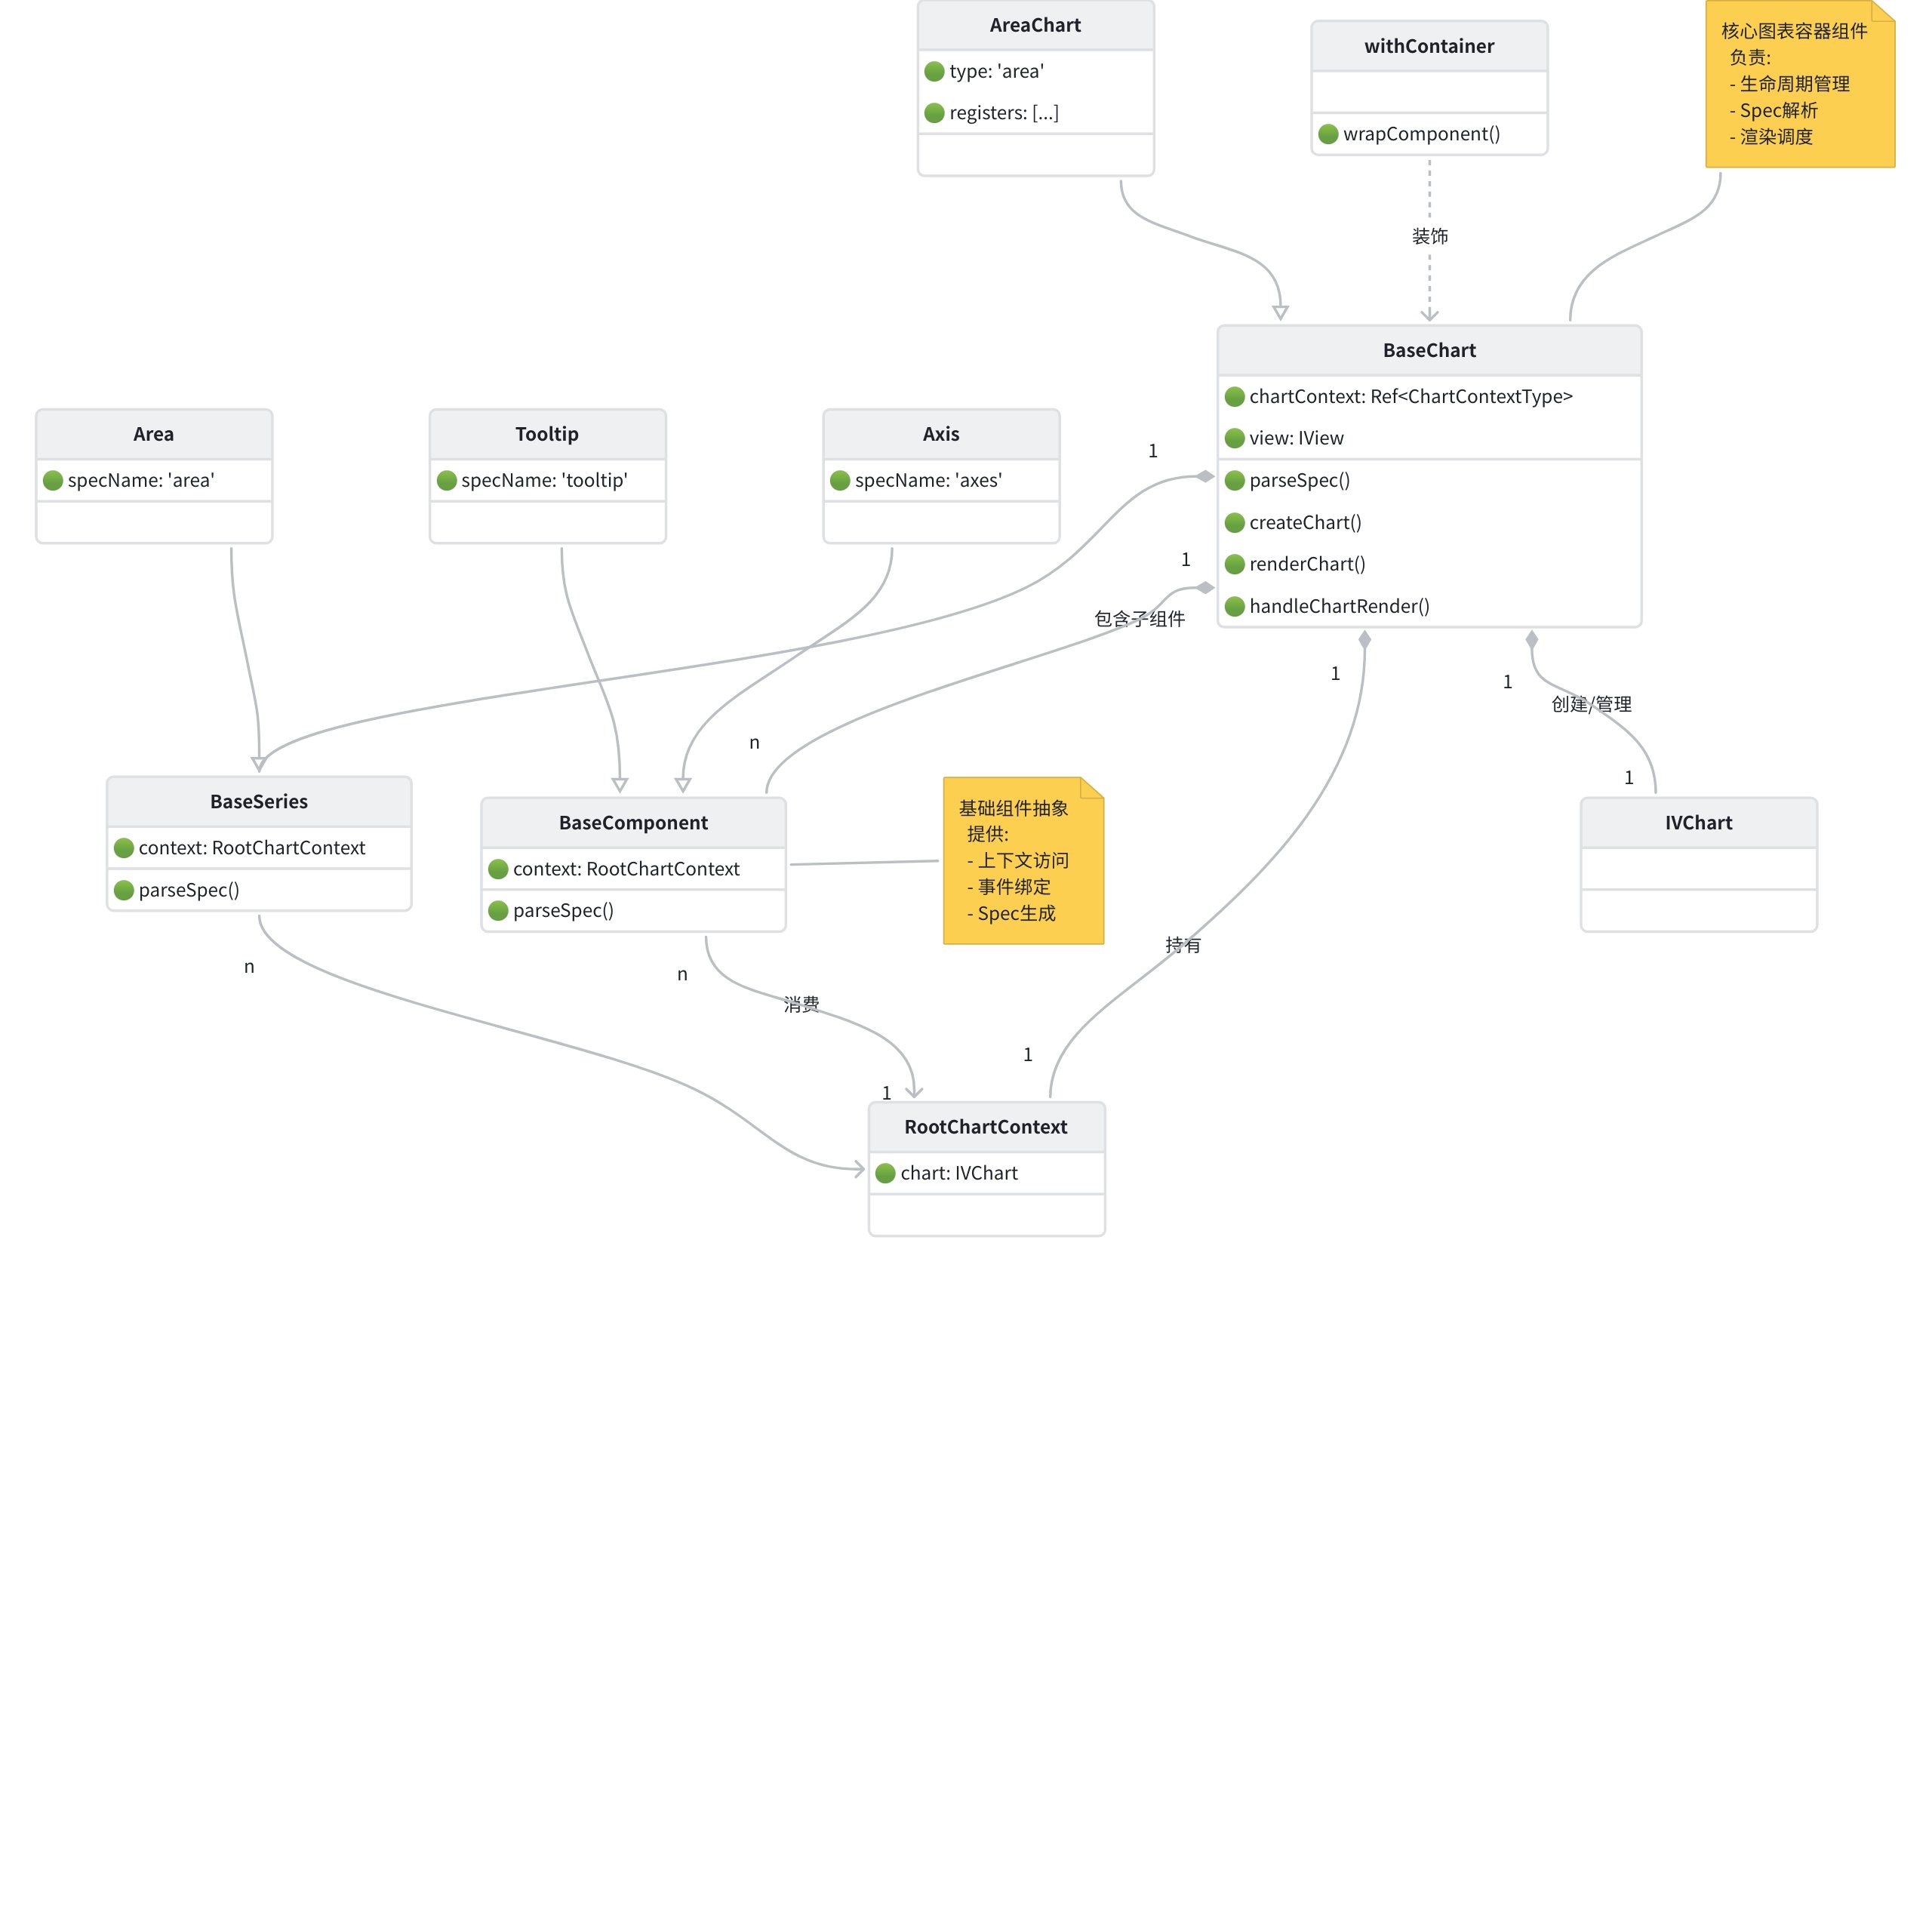
Core Code Implementation

From the implementation perspective, the encapsulation principles of <VChart /> and <LineChart /> do not differ much. Firstly, all Chart components are encapsulated based on BaseChart, with the core code in the following files:

For semantic tags, apart from the above modules, the main focus is on the encapsulation of components and series, with the core code as follows:

Taking AreaChart as an example, the main class relationship diagram is as follows

在接下来的章节,我们将详细的分析Chart组件、系列组件、VChart组件的封装

本文档由以下人员修正整理

玄魂