VSeed, an elegant data composer, transforming complexity into simplicity.
!!!###!!!title=VChart On-demand Loading Mechanism——VisActor/VChart Contributing Documents!!!###!!!!!!###!!!description=---
title: 13.1 VChart On-Demand Loading Mechanism
key words: VisActor,VChart,VTable,VStrory,VMind,VGrammar,VRender,Visualization,Chart,Data,Table,Graph,Gis,LLM
---
VChart is a ready-to-use chart library that provides 20+ chart types by default. As the number of chart types increases and features become richer, package size is a major concern for everyone. Therefore, VChart uses an on-demand loading mechanism to meet various needs for VChart in different scenarios. Before introducing the specific design, we need to understand two prerequisite concepts:
* VChart chart composition
* What is tree-shaking
This article will introduce the principle of VChart's on-demand loading from these two perspectives.
!!!###!!!
VChart is a ready-to-use chart library that provides 20+ chart types by default. As the number of chart types increases and features become richer, package size is a major concern for everyone. Therefore, VChart uses an on-demand loading mechanism to meet various needs for VChart in different scenarios. Before introducing the specific design, we need to understand two prerequisite concepts:
VChart chart composition
What is tree-shaking
This article will introduce the principle of VChart's on-demand loading from these two perspectives.
VChart Chart Composition
Terminology Definition
Before delving into the composition of VChart charts, we need to understand the following terms:
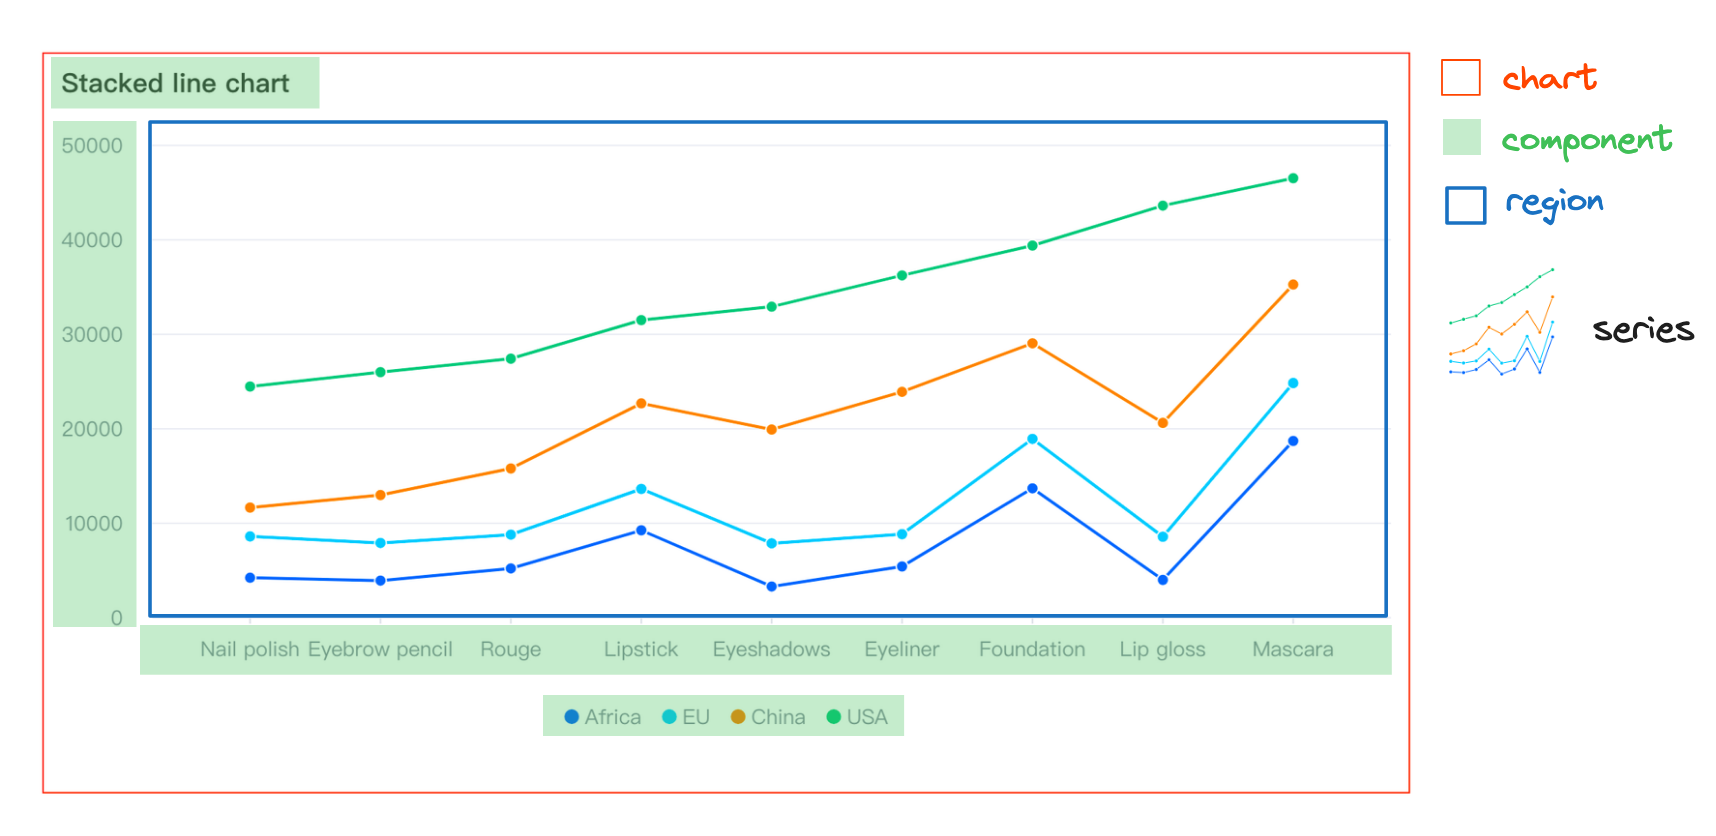
series - The main body of the chart, also known as a series, contains a set of graphic elements and their corresponding chart logic.
mark - Basic graphic elements, also known as basic graphics, such as points, lines, etc.
region - Spatial information element, associated with one or more series, helps in spatial positioning.
component - Components that assist in reading and interacting with the chart, such as legends, axes, tooltips, etc.
layout - Layout, manages the spatial distribution of chart elements.
chart - An abstract concept of a chart, the manager that integrates and manages data, graphic elements, components, and layout elements.
Chart Definition
Logical Layer Chart Elements
We break down the logical layer elements of a chart into the following four parts:
series is the main body of the chart, containing a set of graphic elements and the corresponding type of chart logic. For example, in a line chart, series refers to the collection of points and lines and all the logic of the line chart.
component provides auxiliary capabilities, helping with reading and interacting with the chart, such as legends, axes, tooltips, dataZoom, etc.
region is a spatial information element that can associate with one or more series, helping series with spatial positioning, and is also a minimum combination unit.
chart is an abstract concept, the manager that integrates and manages various elements of the chart, and is the core context of the chart's logical layer.
Simple Chart
A simple chart consists of a region, a series of a determined type, a component, and a chart that manages the chart logic. Taking a common line chart as an example, its composition is as follows
Combination Chart
We define a combination chart as consisting of multiple regions, multiple series of determined types, components, and a chart that manages the chart logic. Here, we encapsulate the chart as a combination chart with type: 'common'.
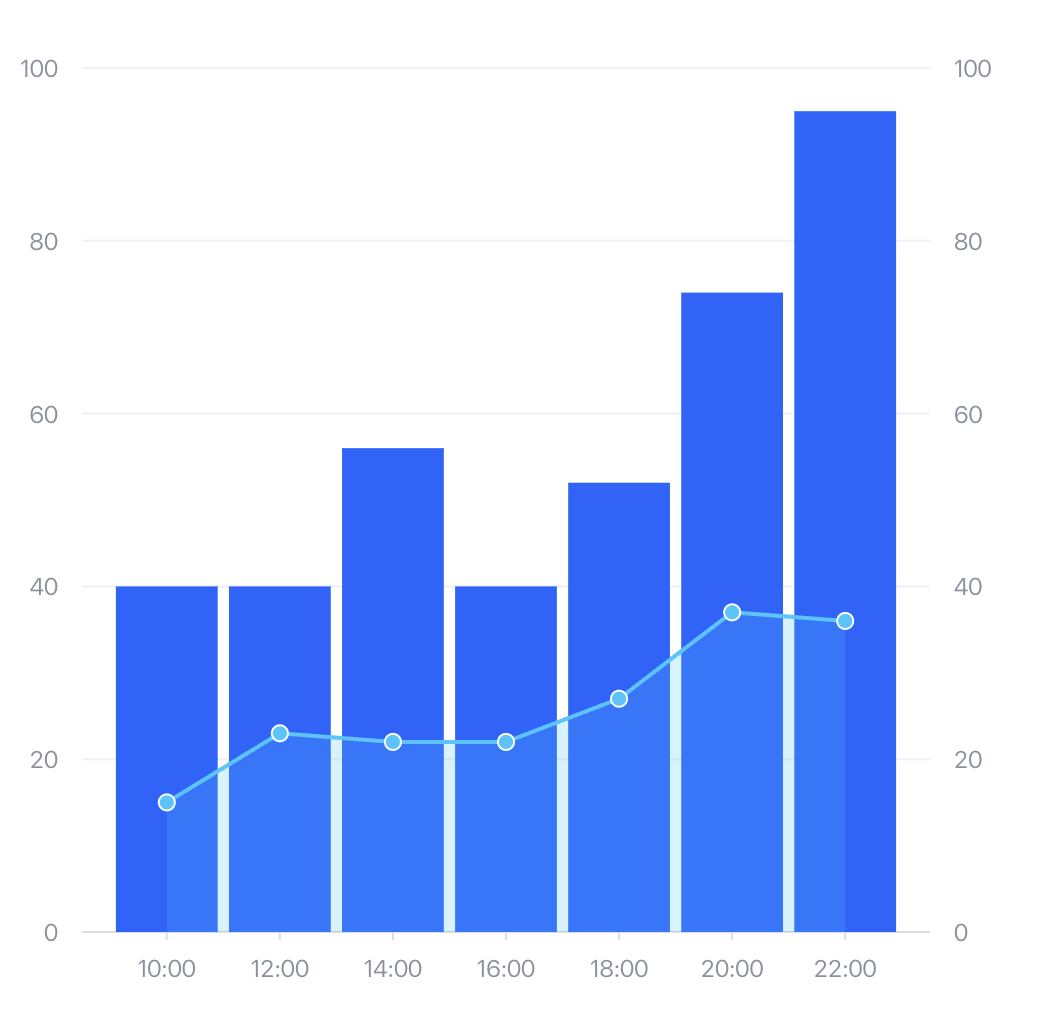
In a combination chart, several different types of sub-charts can be defined. Each sub-chart can independently configure its own data and components, and all sub-charts are by default associated with the same region. At this point, each sub-chart overlaps on the region. We take the common bar-line dual-axis chart as an example to introduce the combination chart in detail:
First, if we need to create a combination chart, we need to declare type: 'common', indicating that the type of chart we need to create is a combination chart.
As mentioned above, the chart is the manager that integrates and manages data, graphic elements, components, and layout elements. Logically, it consists of region + series + layout, and the bar and line correspond to the 'bar' and 'line' series types, respectively. By default, all series are associated with the same region, so we do not need to configure the region here.
Each series can have its own data source, or the data source can be directly configured on the chart. In the series, it is associated through fromDataId or fromDataIndex. In the current example, we choose to configure it on the chart.
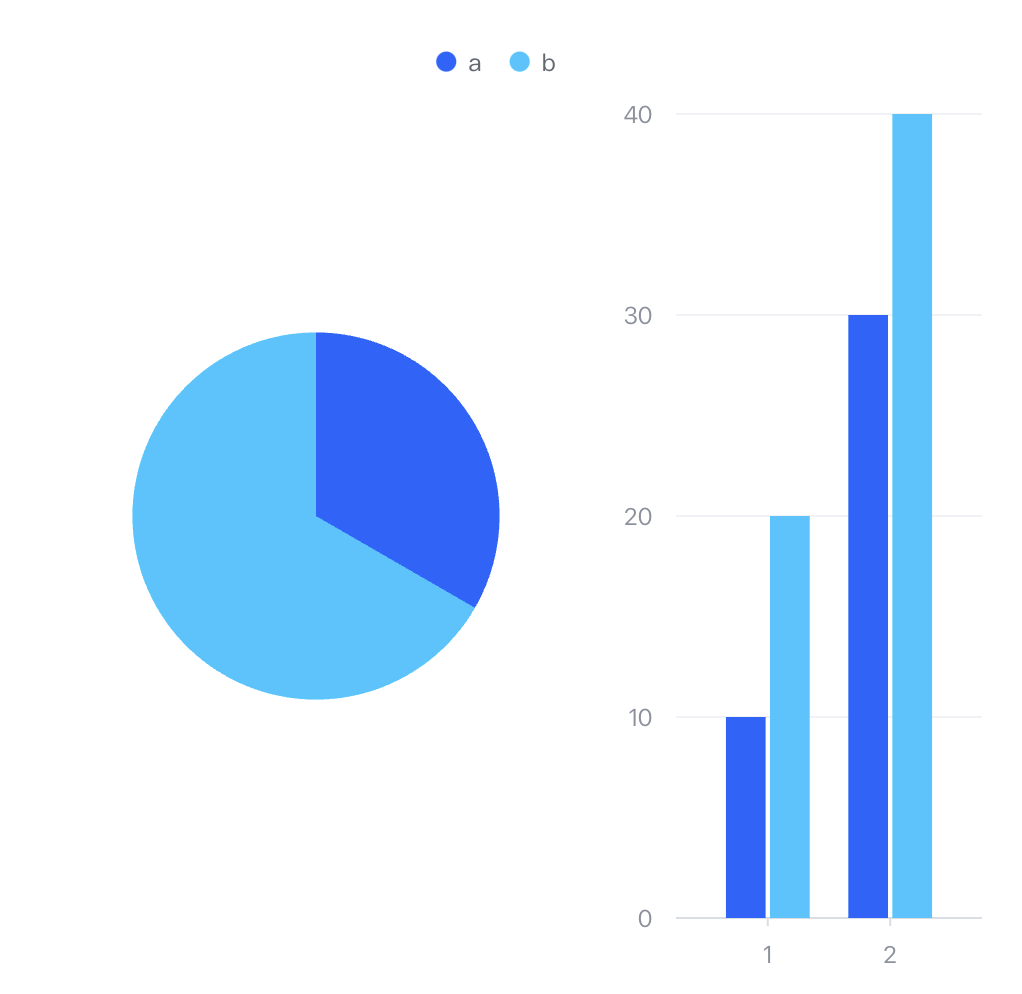
As mentioned earlier, a region is a spatial information element that can be used in conjunction with layouts to divide the canvas into spatial sections using multiple differently positioned regions. At the same time, components can also specify relationships associated with regions. When a component is associated with multiple regions, it will by default collect the data dimensions of all subgraphs under the regions for display, as shown in the following example:
Primitive mark
Primitives are the definition of graphics in the chart view layer. VChart defines primitives in charts, including basic primitives and composite primitives.
Basic primitives include: symbol, rect, line, rule, arc, area, text, path, image, 3D rect, 3D arc, polygon, etc.
Composite primitives are formed by combining multiple basic primitives. We collectively refer to basic primitives and composite primitives as primitives.
Logical layer elements (such as series) are composed of several primitives. For example, the area chart ('area') series includes points, lines, and areas, corresponding to the basic primitives: symbol, line, area.
What is tree-shaking
Tree Shaking is a code optimization technique used to remove unused code (dead code) in JavaScript. This concept was first proposed by Rollup and later widely adopted by build tools such as Webpack.
The implementation of Tree Shaking mainly relies on these features of ES Module:
Import and export statements can only be at the top level of the module
The names of imported and exported modules cannot be dynamic
The packaging tool constructs a module dependency graph during the marking phase based on the dependencies between files, analyzes import and export relationships, and removes unused exports during the packaging phase, retaining only the used code.
When using Tree Shaking, the sideEffects configuration plays a crucial role in ensuring that unused code is correctly removed. In the project's package.json file, the sideEffects field is used to inform the bundler which files or modules have side effects, meaning they perform actions other than exporting values (such as modifying global state, executing initialization code, etc.). If a module has no side effects, the bundler can safely remove unreferenced parts.
The Principle of VChart On-Demand Loading
Based on the above understanding of VChart chart composition and the concept of Tree Shaking, the core idea of VChart on-demand loading is to use Tree Shaking technology to only bundle the chart types, components, and graphic elements that the user actually uses, thereby reducing the package size. In the next chapter, we will detail some implementation specifics.
This document was revised and organized by the following personnel