VSeed, an elegant data composer, transforming complexity into simplicity.
!!!###!!!title=Primitive Basic Concepts——VisActor/VChart Contributing Documents!!!###!!!!!!###!!!description=---title: 6.1 Basic Concepts of Marks key words: VisActor,VChart,VTable,VStrory,VMind,VGrammar,VRender,Visualization,Chart,Data,Table,Graph,Gis,LLM---!!!###!!!
Basic Concepts
In VChart, Marks are the basic drawing units that make up a chart, representing the basic visual elements in a chart, such as points, lines, rectangles, polygons, etc. Generally, the users of marks mainly include:
Series: The part of the chart used to display data. Different types of series are composed of different types of marks. For example, a line chart is composed of point marks (endpoints) and line marks, while a pie chart is mainly composed of arc marks and area marks... At this time, the types of marks contained in the series are determined by the type of series.
Component: Chart elements that provide auxiliary capabilities in the chart, helping with chart reading and interaction, such as axes, legends, annotations, etc. These components are also composed of marks. Thus, marks are not only used to display data but also serve as the basic units that make up various elements in a chart.
Functions of Marks
Overall, the functions of marks can be summarized as:
Constituting Charts
Composing various components of a chart, for example, a legend item is composed of symbol marks and text marks.
Displaying Data
Data Mapping: Marks map data into visual elements, making abstract data intuitive and understandable.
Information Conveyance: Through different types and styles of marks, convey the characteristics and trends of data.
Interaction Support: Marks support user interaction with the chart, such as hover, click, etc., enhancing the explorability of data.
Overview of Mark Types
VChart defines various basic and composite mark types, including but not limited to:
Basic Marks:
Symbol: Used to represent basic shapes of data points, such as points in a scatter plot.
Rectangle (rect): Used to draw bars in a bar chart, etc.
Line: Used to connect data points, commonly seen in line charts.
Rule: Draws a straight line at a specific position, can be used to indicate thresholds, etc.
Arc: Used to draw arcs, such as sectors in a pie chart.
Area: Represents filled areas, commonly used in area charts.
Text: Adds text annotations in the chart.
Path: Draws paths of arbitrary shapes.
Image: Embeds images in the chart.
3D Rectangle (rect3d): Used to draw 3D bar charts, etc.
3D Arc (arc3d): Used to draw sectors of 3D pie charts, etc.
Polygon: Draws polygonal areas.
Custom Marks: See details
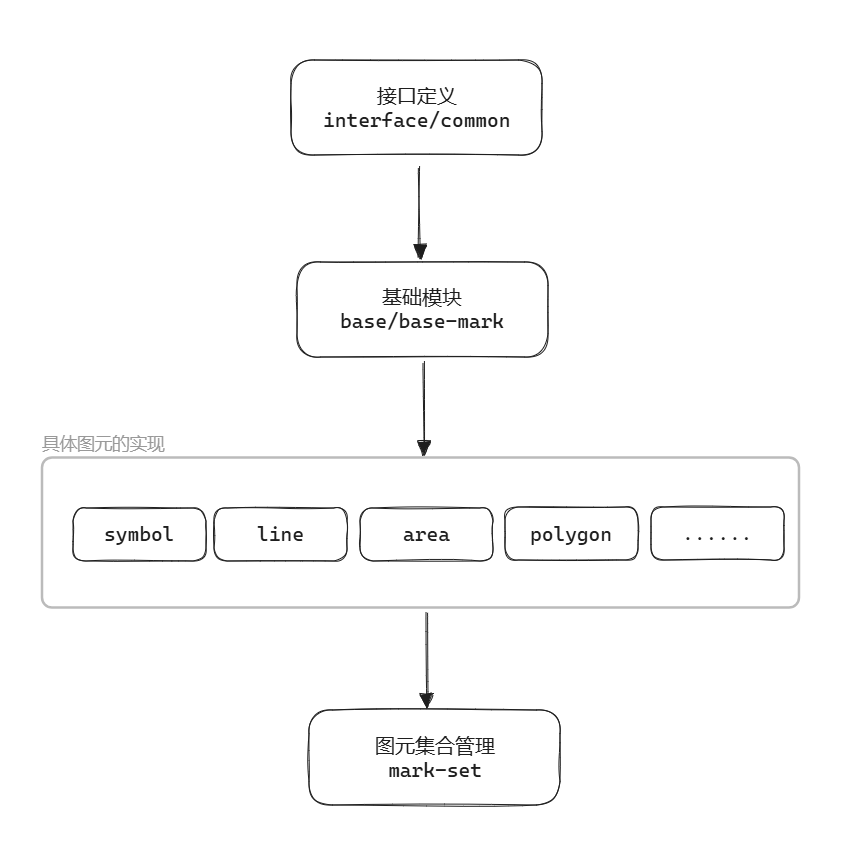
Code Structure
The core code entry for implementing marks is packages/vchart/src/mark. This section provides a brief description of the code structure and functionality. For the specific logic of marks, see .
The mark module can be divided into the following core modules:
Among them:
All specific Marks inherit from BaseMark and bridge with vgrammar through CompilableMark
All Marks implement the IMarkRaw interface, and for the style system, the IVisualSpecStyle interface needs to be implemented
The inheritance chain where the graphic element is located:
Basic Module (base/)
Core file: base-mark.ts
Function overview: The base class for all graphic elements, containing common attributes and operations of the elements. Key attributes include: