
In the previous chapters, we talked about the composition and basic principles of charts. Now let's see how to assemble a VChart chart using declarative syntax.
3.1 Interface Definition
A basic spec needs to include the following parts:
-
typeChart type -
dataData source -
Data mapping, in most cases in a Cartesian coordinate system as
xFieldandyField, in a polar coordinate system ascategoryFieldandvalueField -
Series configuration, VChart charts are composed of series, which include elements and labels. The configuration of elements and labels is in the series configuration
-
Component configuration, such as
legends,axes, etc. Except for composite charts that must configureaxes, the configuration of components for other charts is actually optional and can be configured as needed
3.1.1 Chart Type
In the spec, we first need to decide the chart type, for example:
{
  "type": "bar"
}
Common chart types include bar, line, pie, and more chart types can be referenced in the API documentation: https://www.visactor.io/vchart/option
Note that there is a special chart type called common, which is a composite chart type series. Examples will be provided later.
3.1.2 Data Source
Data is the foundation of chart visualization, and we need to specify the data source in the spec. Typically, data is represented in JSON format, using the data field to specify it. For example, we can specify the data source in the following format:
{
  "data": [
    {
      "id": "barData",
      "values": [
        { "type": "A", "year": "1930", "value": 129 },
        { "type": "A", "year": "1940", "value": 133 },
        { "type": "A", "year": "1950", "value": 130 },
        { "type": "A", "year": "1960", "value": 126 },
        { "type": "A", "year": "1970", "value": 117 },
        { "type": "A", "year": "1980", "value": 114 },
        { "type": "A", "year": "1990", "value": 111 },
        { "type": "A", "year": "2000", "value": 89 },
        { "type": "A", "year": "2010", "value": 80 },
        { "type": "A", "year": "2018", "value": 80 },
        { "type": "B", "year": "1930", "value": 22 },
        { "type": "B", "year": "1940", "value": 13 },
        { "type": "B", "year": "1950", "value": 25 },
        { "type": "B", "year": "1960", "value": 29 },
        { "type": "B", "year": "1970", "value": 38 },
        { "type": "B", "year": "1980", "value": 41 },
        { "type": "B", "year": "1990", "value": 57 },
        { "type": "B", "year": "2000", "value": 87 },
        { "type": "B", "year": "2010", "value": 98 },
        { "type": "B", "year": "2018", "value": 99 }
      ]
    }
  ]
}
The id field is used to identify the data source, and the values field is used to specify the data of the data source.
In VChart, in most cases, we expect to use flattened data objects. The difference between flattened and non-flattened data objects is shown in the example below
// 非展平数据对象
[
    {date: "Monday", class No.1: 20, class No.2: 30},
    {date: "Tuesday", class No.1: 25, class No.2: 28},
]
// 展平数据对象
[
    { date: "Monday", class: "class No.1", score: 20 },
    { date: "Monday", class: "class No.2", score: 30 },

    { date: "Tuesday", class: "class No.1", score: 25 },
    { date: "Tuesday", class: "class No.2", score: 28 },
]
The most important significance of flattening data is that it allows for a one-to-one correspondence between data and graphics.
3.1.3 Data Mapping
Next, we need to map the data to the basic graphical elements (marks) of the chart. For the grouped bar chart in this tutorial, we specify xField, yField, and seriesField. Here, xField and yField are used for position mapping, and seriesField is used for color mapping
{
  "xField": ["year", "type"],
  "yField": "value",
  "seriesField": "type"
}
3.1.4 Series Configuration
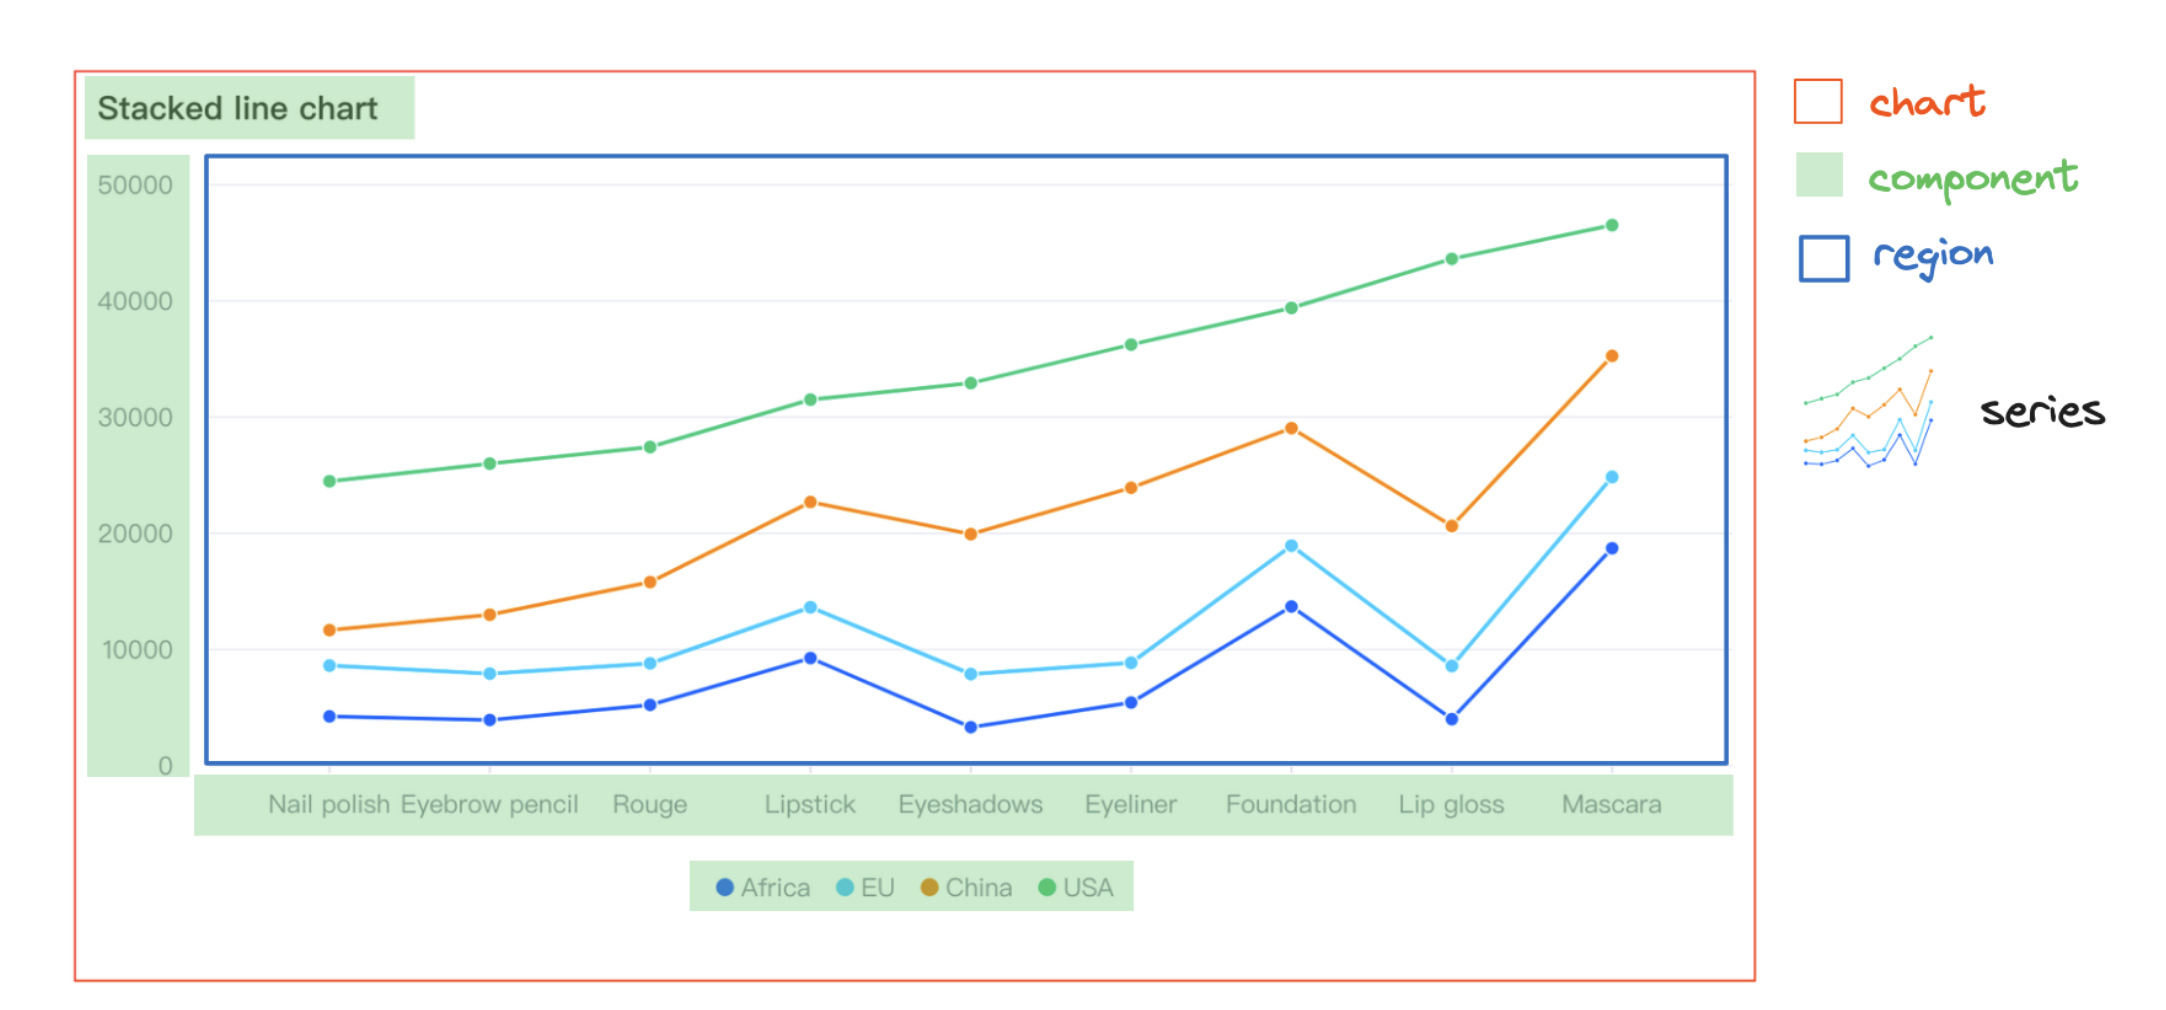
A series refers to the main body of the chart in the image, such as the line in a line chart, which will be introduced in more detail later.
3.1.5 Component Configuration
VChart also supports configuring various components of the chart, such as axes, legends, crosshair, and tooltip. Currently, the components supported by VChart are:
3.2 Series
3.2.1 Concept and Types
In VChart, Series are the core building blocks of visual charts, responsible for mapping data into visual expressions. A series represents a set of related data items that share the same visual representation (such as line, bar, etc.). Series are converters from data to graphics, including data processing, coordinate mapping, visual encoding, and other functions. Each series type corresponds to a specific visual representation form, with unique data structure requirements and visual mapping rules.
Basic and Coordinate System Classes
-
base: Basic implementation of series, providing common functions for all series
-
cartesian: Cartesian coordinate system base class, used for X-Y axis series
-
polar: Polar coordinate system base class, used for circular and radial series
-
geo: Geographic coordinate system base class, used for map-related series
Cartesian Coordinate System Series
-
bar: Bar chart, used for category data comparison
-
line: Line chart, showing data trends and changes
-
area: Area chart, emphasizing cumulative changes in data volume
-
scatter: Scatter plot, showing the distribution of data points
-
box-plot: Box plot, displaying data distribution and outliers
-
dot: Dot plot, simplified scatter plot
-
heatmap: Heatmap, using color intensity to represent value size
-
range-area: Range area chart, showing upper and lower boundary areas
-
range-column: Range column chart, showing data range
-
waterfall: Waterfall chart, showing cumulative effects
Polar Coordinate System Series
-
pie: Pie chart, showing the relationship between part and whole
-
rose: Rose chart, circular display of multidimensional data
-
radar: Radar chart, radial display of multivariable data
Hierarchical Series
-
treemap: Treemap, nested rectangle display of hierarchical structure
-
sunburst: Sunburst chart, circular display of hierarchical data
-
circle-packing: Circle packing chart, nested circle display of hierarchical structure
Relational Series
-
sankey: Sankey diagram, showing flow and conversion relationships
-
correlation: Correlation chart, showing correlations between different dimensions
-
venn: Venn diagram, showing intersection relationships between sets
-
link: Link chart, showing connections between entities
Special Series
-
funnel: Funnel chart, showing conversion rates of multi-stage processes
-
gauge: Gauge chart, showing the achievement of a single indicator
-
liquid: Liquid chart, using liquid fill effect to show progress
-
map: Map series, displaying data in geographic space
-
mosaic: Mosaic chart, using rectangle area to display multidimensional data relationships
-
pictogram: Pictogram chart, using icons to represent data
-
progress: Progress bar, linear display of completion
-
word-cloud: Word cloud chart, displaying text data based on word frequency
3.2.2 Series Data Management
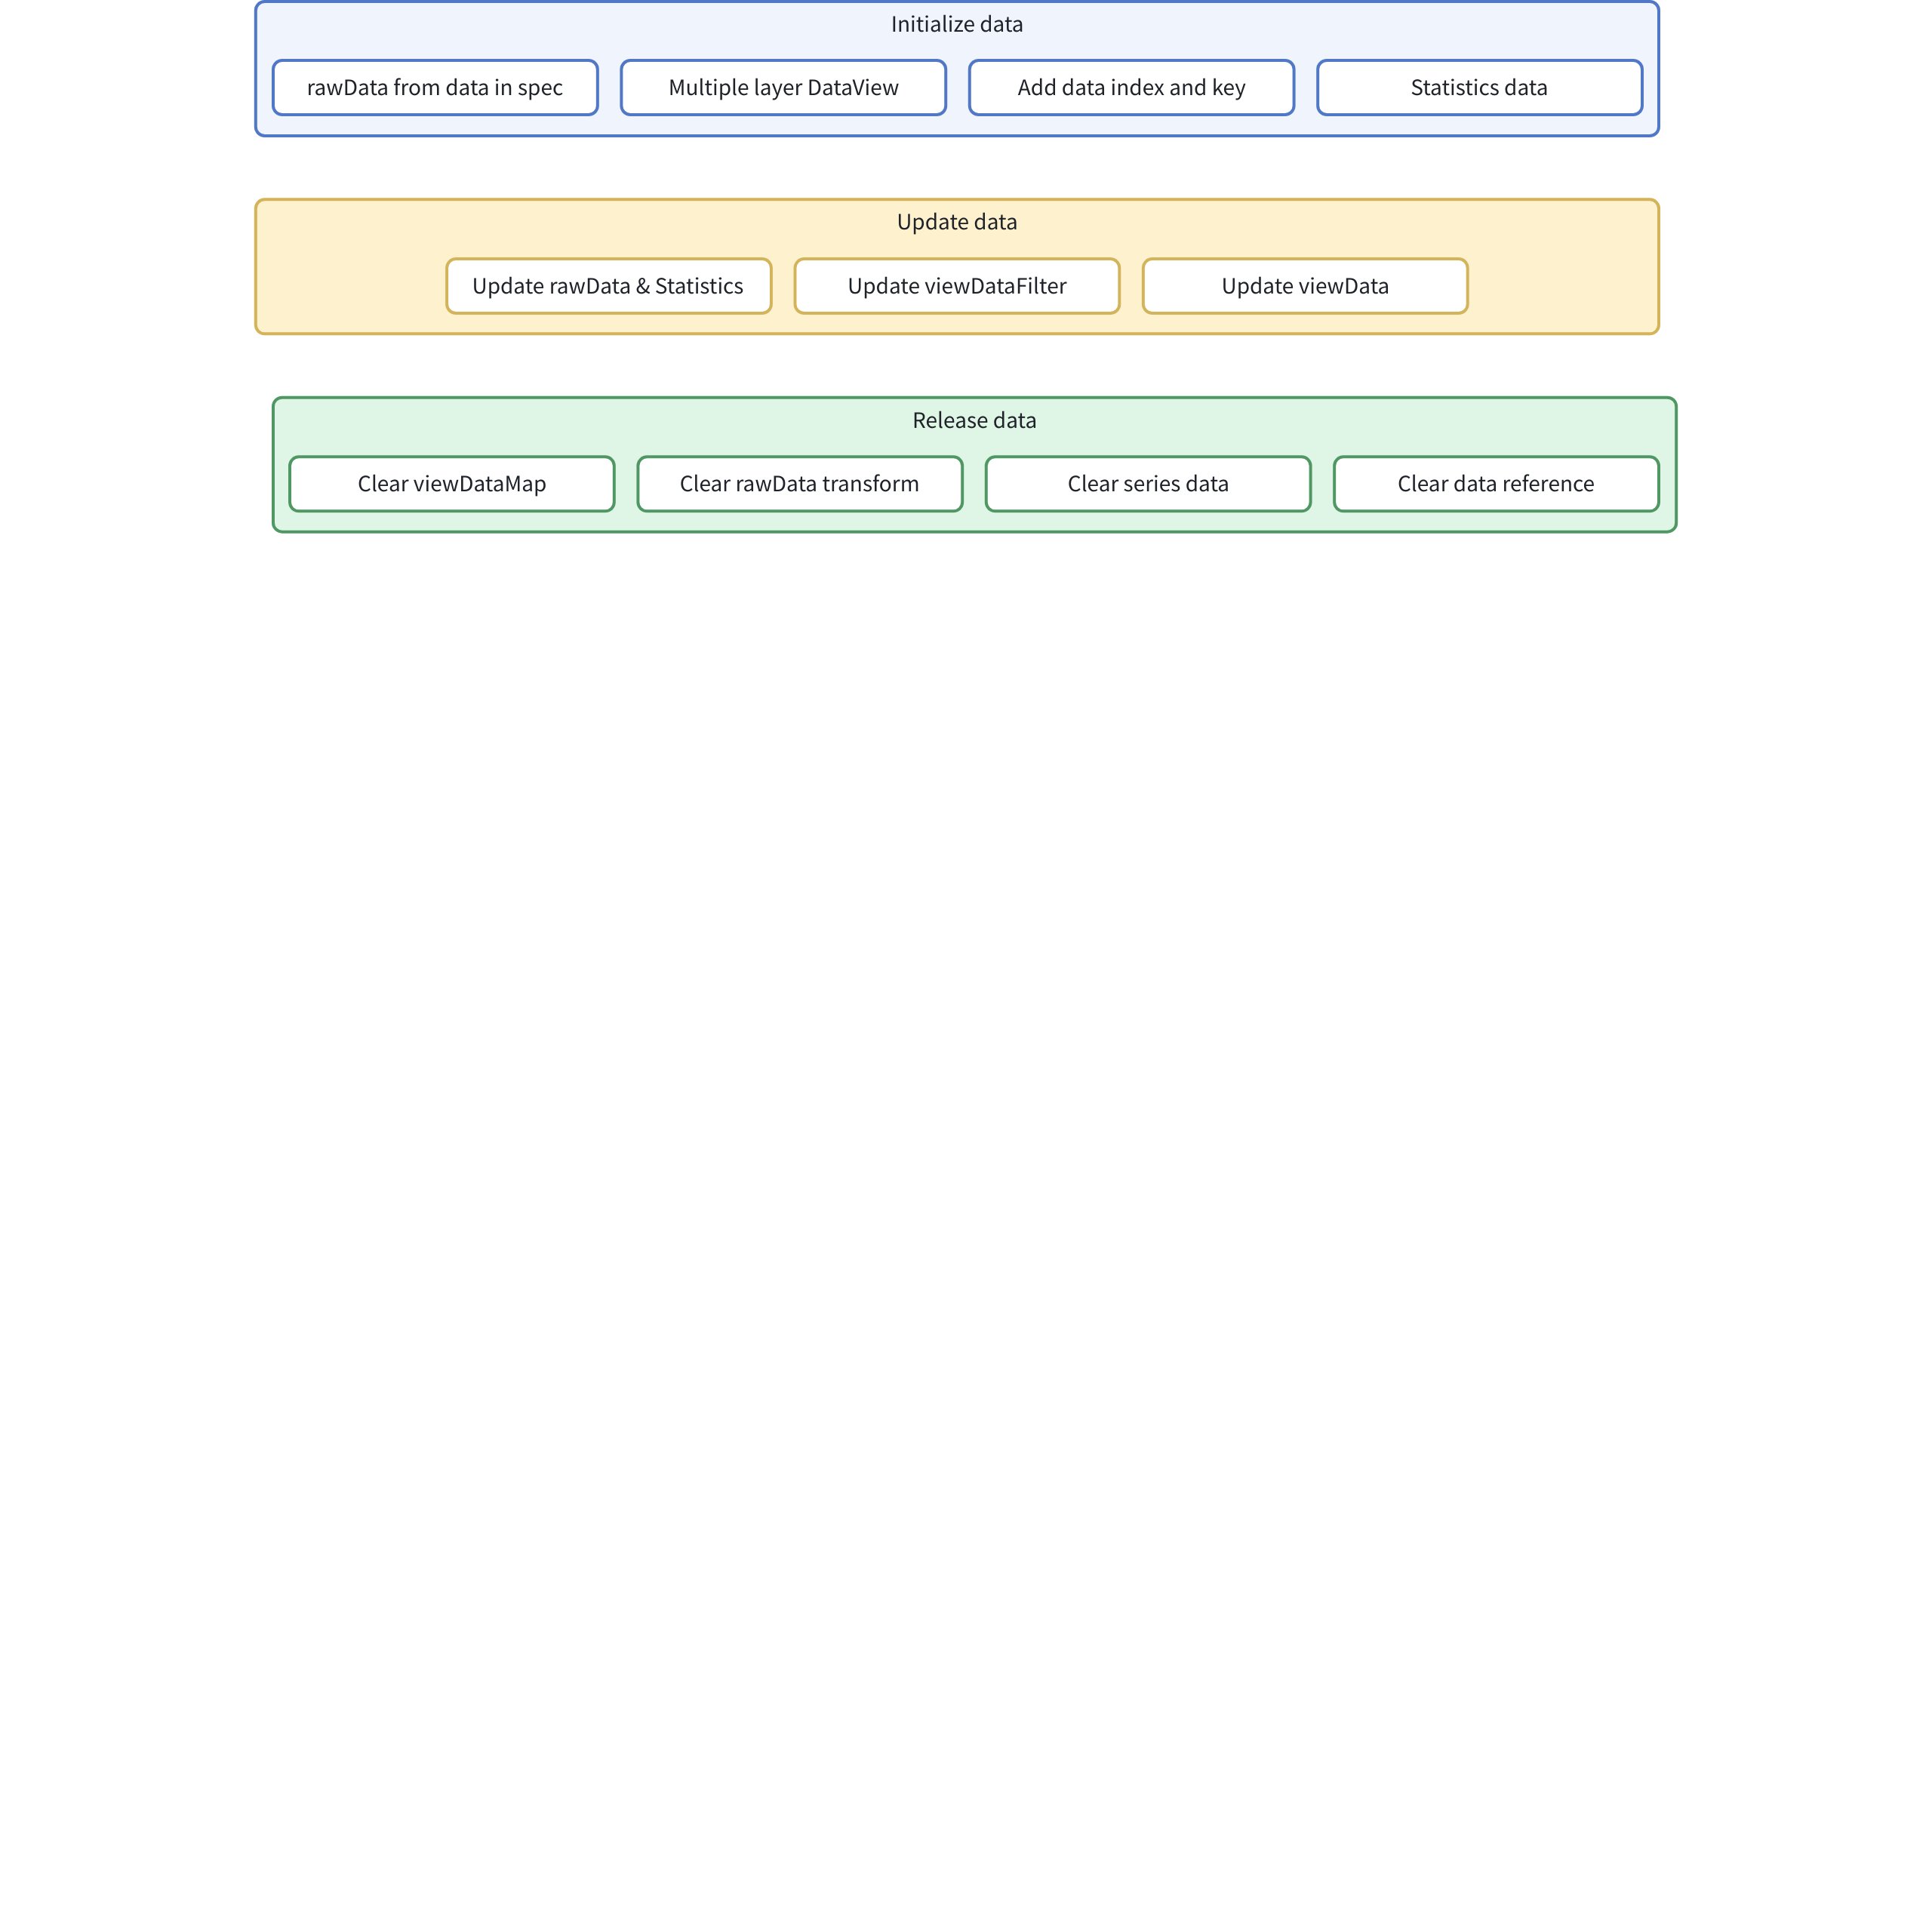
Initialization Phase
// packages/vchart/src/series/base/base-series.ts
  protected initData(): void {
    const d = this._spec.data ?? this._option.getSeriesData(this._spec.dataId, this._spec.dataIndex);
    if (d) {
      this._rawData = dataToDataView(d, this._dataSet, this._option.sourceDataList);
    }
    this._rawData?.target?.addListener('change', this.rawDataUpdate.bind(this));
    this._addDataIndexAndKey();
    // 初始化viewData
    if (this._rawData) {
      if (this.getStack()) {
        // 初始化viewDataFilter
        this._viewDataFilter = dataViewFromDataView(this._rawData, this._dataSet, {
          name: `${this.type}_${this.id}_viewDataFilter`
        });
      }

      // 初始化viewData
      const viewData = dataViewFromDataView(this.getStack() ? this._viewDataFilter : this._rawData, this._dataSet, {
        name: `${this.type}_${this.id}_viewData`
      });
      this._data = new SeriesData(this._option, viewData);

      if (this.getStack()) {
        this._viewDataFilter.target.removeListener('change', viewData.reRunAllTransform);
      }
    }

    this.initInvalidDataTransform();
  }
-
Extract data from the spec's data or option and convert it into a DataView
-
Then register a Listener, which triggers the rawDataUpdate function when the data changes
-
Add index and key to the Data
-
Then we will generate DataViews of different levels
-
If stacked data is needed, we create an intermediate DataView
-
If stacked data is not needed, directly create viewData, which is used by the chart for statistics and rendering
Create a series of statistics, such as maximum, minimum, etc. The statistics generated by different types of charts may vary. The specific chart's series class will implement this `abstract function getStatisticFields` to control what Statistics are generated.


```xml
  abstract getStatisticFields(): {
    key: string;
    operations: StatisticOperations;
  }[];
Update Data
Data Layer
// 1. 原始数据视图
protected _rawData!: DataView;

// 2. 原始数据统计视图
protected _rawDataStatistics?: DataView;

// 3. 原始数据统计缓存
protected _rawStatisticsCache: Record<string, { values?: any[]; min?: number; max?: number }>;

// 4. 更新原始数据
updateRawData(d: any): void {
  if (!this._rawData) {
    return;
  }
  this._rawData.updateRawData(d);
}

// 5. 原始数据更新处理
rawDataUpdate(d: DataView): void {
  // 重新计算统计信息
  this._rawDataStatistics?.reRunAllTransform();
  // 清空缓存
  this._rawStatisticsCache = null;
  // 触发事件
  this.event.emit(ChartEvent.rawDataUpdate, { model: this });
}
Filter Layer
// 1. 数据过滤视图
protected _viewDataFilter: DataView = null;

// 2. 过滤完成处理
viewDataFilterOver(d: DataView): void {
  this.event.emit(ChartEvent.viewDataFilterOver, { model: this });
}

// 3. 添加数据过滤
addViewDataFilter(option: ITransformOptions) {
  (this._viewDataFilter ?? this.getViewData())?.transform(option, false);
}

// 4. 重新过滤数据
reFilterViewData() {
  (this._viewDataFilter ?? this.getViewData())?.reRunAllTransform();
}
View Layer
// 1. 视图数据
protected _data: SeriesData = null;

// 2. 视图数据统计
protected _viewDataStatistics!: DataView;

// 3. 视图数据更新处理
viewDataUpdate(d: DataView): void {
  this.event.emit(ChartEvent.viewDataUpdate, { model: this });
  this._data?.updateData();
  this._viewDataStatistics && this._viewDataStatistics.reRunAllTransform();
}

// 4. 统计信息更新处理
viewDataStatisticsUpdate(d: DataView): void {
  this.event.emit(ChartEvent.viewDataStatisticsUpdate, { model: this });
}
Release Phase
Mainly divided into the following processes:
release(): void {
  super.release();

  // 1. 清理视图数据映射
  this._viewDataMap.clear();

  // 2. 清理原始数据转换
  const transformIndex = this._rawData?.transformsArr?.findIndex(t => t.type === 'addVChartProperty');
  if (transformIndex >= 0) {
    this._rawData.transformsArr.splice(transformIndex, 1);
  }

  // 3. 释放系列数据
  this._data?.release();

  // 4. 清空数据引用
  this._dataSet = null;
  this._data = null;
  this._rawData = null;
  this._rawDataStatistics = null;
  this._viewDataStatistics = null;
  this._viewStackData = null;
}
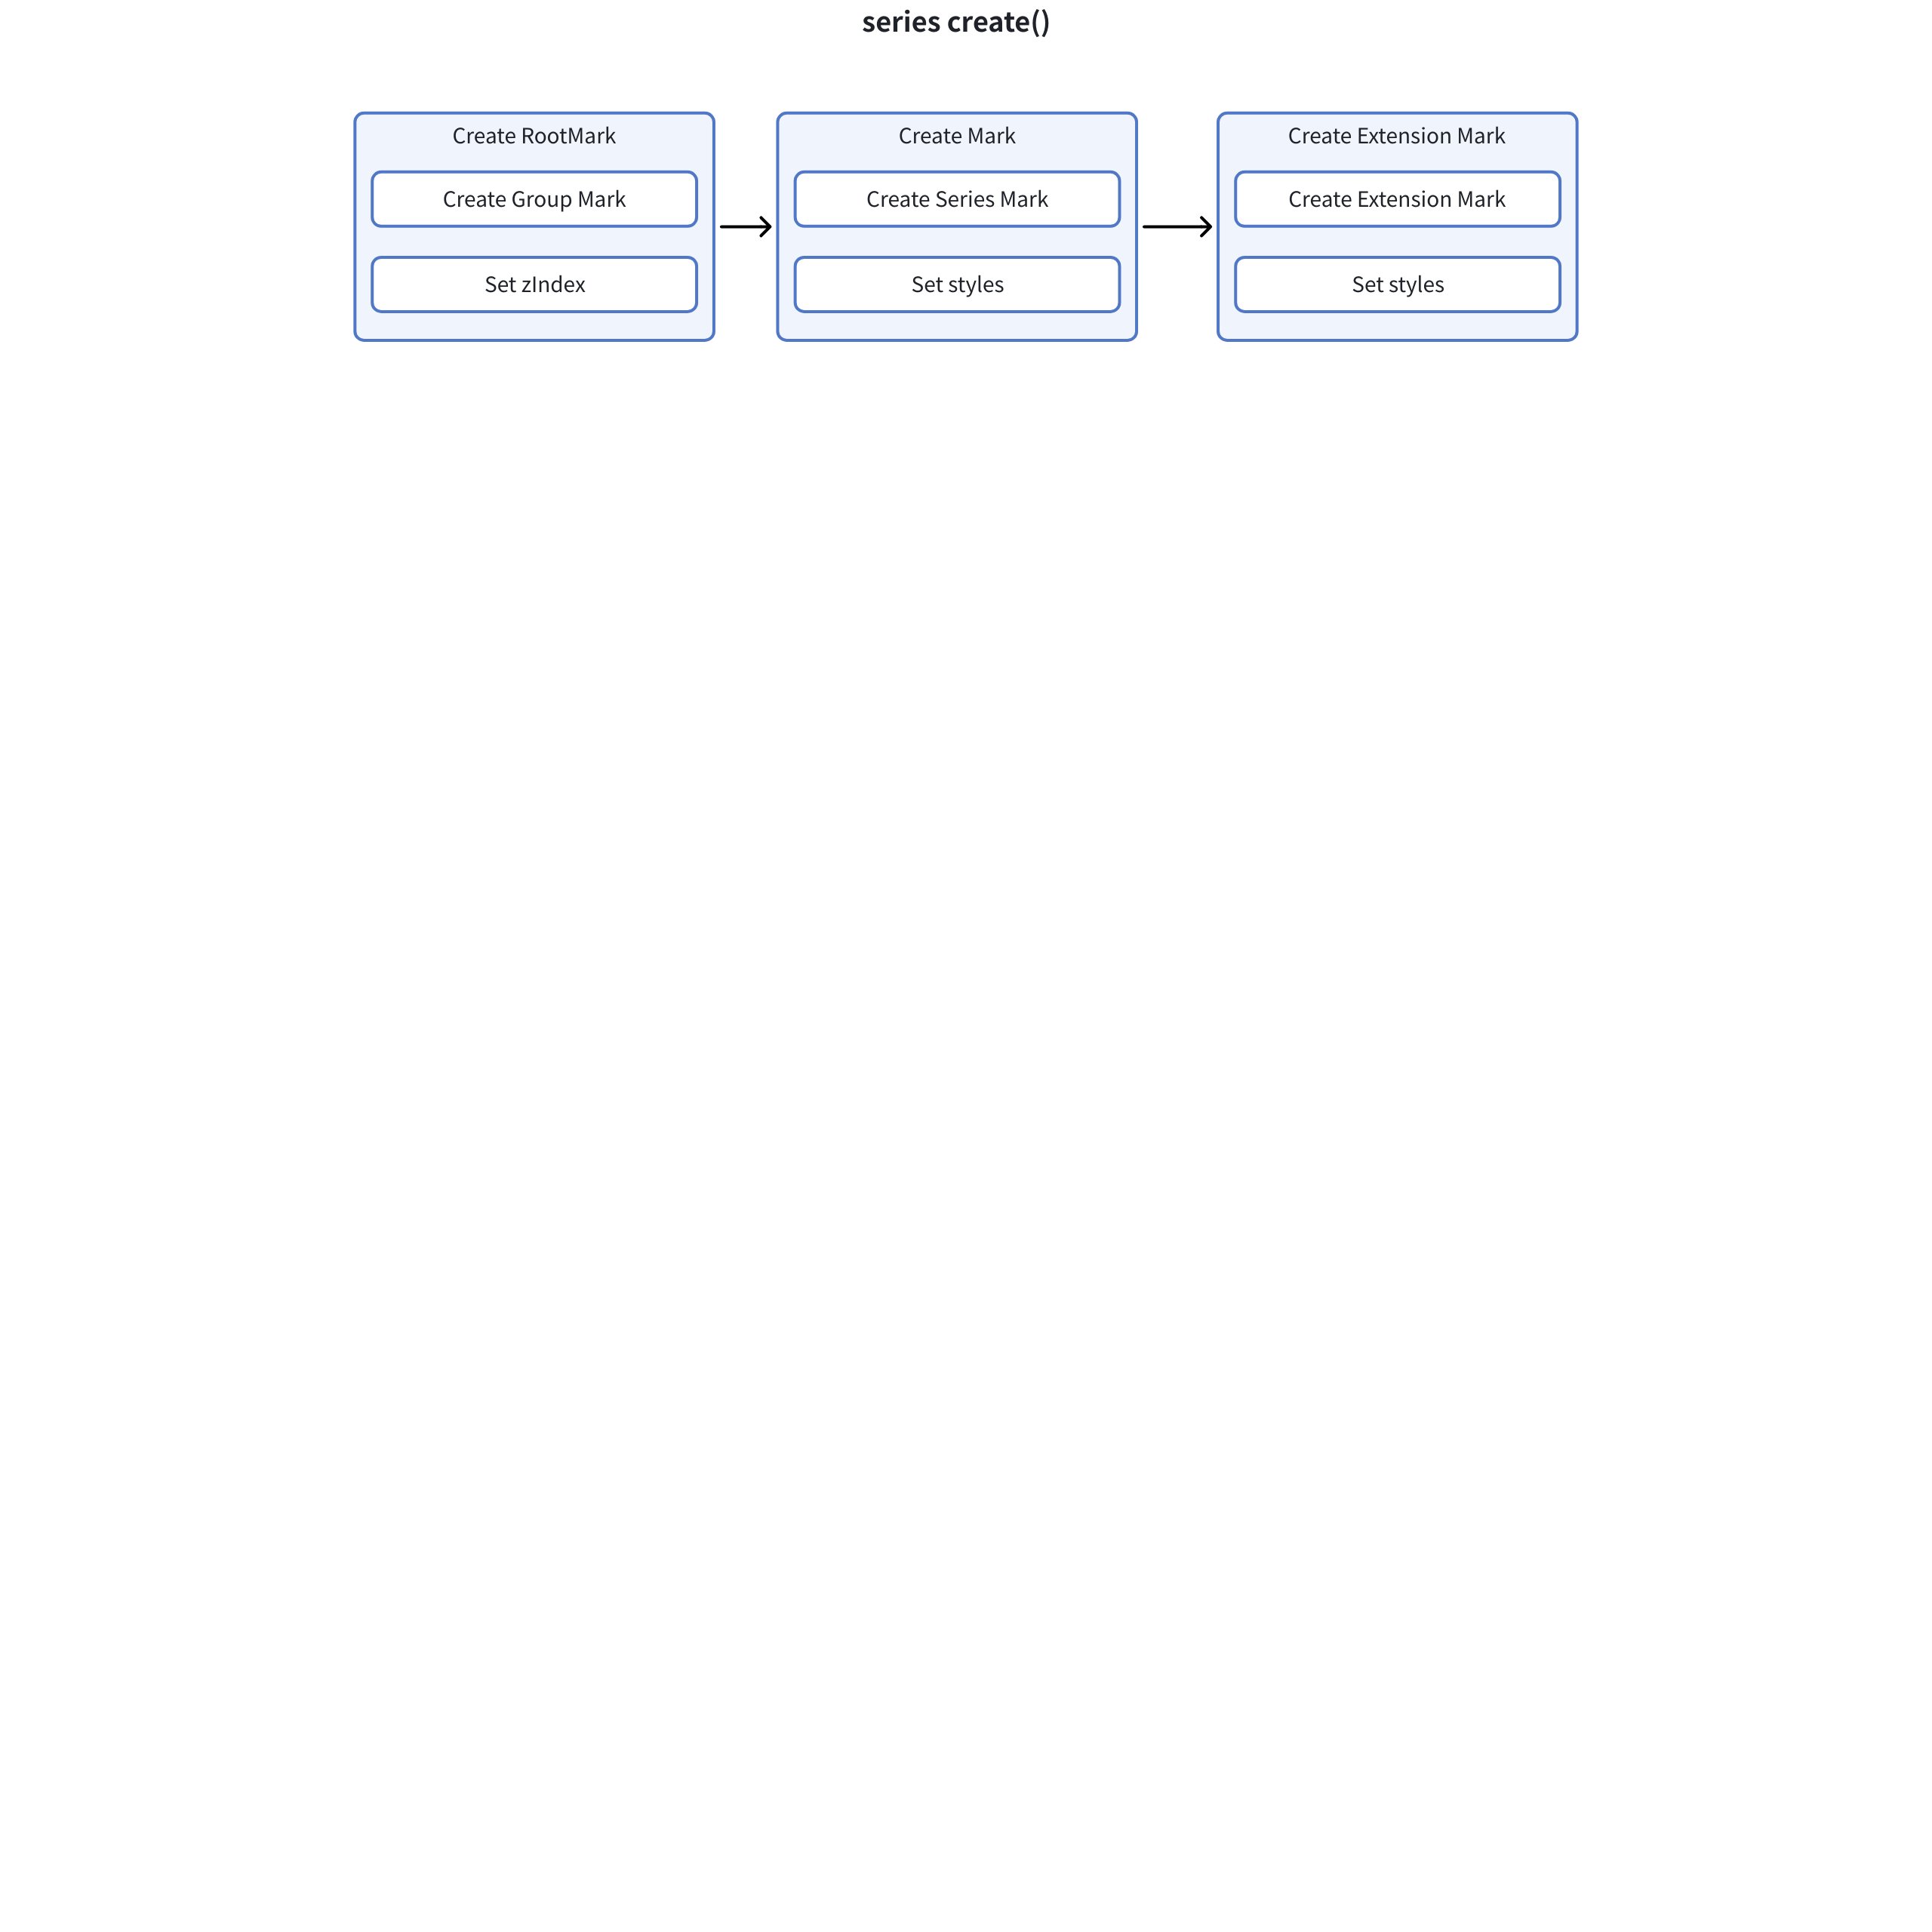
3.2.3 Creation of Series Primitives
- Root Primitive:
-
Function: Acts as a container to organize and manage other primitives
-
Characteristics: Must be of group type
-
Position: Topmost level
- Series Primitive:
-
Function: Implements the core visualization functionality of the chart, used for drawing series
-
Characteristics: Related to specific chart types
-
Position: Main primitive under the root primitive
- Extension Primitive:
-
Function: Provides additional functional support
-
Characteristics: Optional, used to enhance chart functionality, such as labels
-
Position: Auxiliary primitive under the root primitive
Create Entry
// BaseSeries 中的 created 方法
created(): void {
  super.created();

  // 1. 构建图元属性上下文
  this._buildMarkAttributeContext();

  // 2. 初始化数据
  this.initData();
  this.initGroups();
  this.initStatisticalData();

  // 3. 初始化图元
  this.initRootMark();
  this.initMark();

  // 4. 初始化扩展图元
  const hasAnimation = isAnimationEnabledForSeries(this);
  this._initExtensionMark({ hasAnimation });

  // 5. 初始化样式和状态
  this.initMarkStyle();
  this.initMarkState();

  // 6. 初始化动画
  if (hasAnimation) {
    this.initAnimation();
  }

  // 7. 初始化交互
  if (!this._option.disableTriggerEvent) {
    this.initInteraction();
  }

  this.afterInitMark();
}
Root Element Creation
initRootMark() {
  // 1. 创建根图元
  this._rootMark = this._createMark(
    {
      type: MarkTypeEnum.group,
      name: `seriesGroup_${this.type}_${this.id}`
    },
    {
      parent: this._region.getGroupMark?.(),
      dataView: false
    }
  ) as IGroupMark;

  // 2. 设置层级
  this._rootMark.setMarkConfig({
    zIndex: this._spec.zIndex ?? this.layoutZIndex
  });
}
Series Primitive Creation
// 创建图元的通用方法
protected _createMark<M extends IMark>(
  markInfo: ISeriesMarkInfo,
  option: ISeriesMarkInitOption = {},
  config: ICompileMarkConfig = {}
) {
  const {
    key,
    groupKey,
    skipBeforeLayouted,
    themeSpec = {},
    markSpec,
    dataView,
    dataProductId,
    parent,
    isSeriesMark,
    depend,
    stateSort,
    noSeparateStyle = false
  } = option;

  // 1. 创建图元
  const m = super._createMark<M>(markInfo, {
    key: key ?? this._getDataIdKey(),
    seriesId: this.id,
    attributeContext: this._markAttributeContext,
    componentType: option.componentType,
    noSeparateStyle
  });

  if (isValid(m)) {
    // 2. 添加到图元集合
    this._marks.addMark(m, { name: markInfo.name });

    // 3. 设置系列图元
    if (isSeriesMark) {
      this._seriesMark = m;
    }

    // 4. 设置父级关系
    if (isNil(parent)) {
      this._rootMark?.addMark(m);
    } else if (parent !== false) {
      parent.addMark(m);
    }

    // 5. 设置数据视图
    if (isNil(dataView)) {
      m.setDataView(this.getViewData(), this.getViewDataProductId());
      m.setSkipBeforeLayouted(true);
    } else if (dataView !== false) {
      m.setDataView(dataView, dataProductId);
    }

    // 6. 设置其他属性
    if (isBoolean(skipBeforeLayouted)) {
      m.setSkipBeforeLayouted(skipBeforeLayouted);
    }

    if (isValid(depend)) {
      m.setDepend(...array(depend));
    }

    if (!isNil(groupKey)) {
      m.setGroupKey(groupKey);
    }

    if (stateSort) {
      m.setStateSortCallback(stateSort);
    }

    // 7. 设置图元配置
    const markConfig: IMarkConfig = {
      ...config,
      morph: config.morph ?? false,
      support3d: is3DMark(markInfo.type as MarkTypeEnum) ||
                (config.support3d ?? (spec.support3d || !!(spec as any).zField)),
      morphKey: spec.morph?.morphKey || `${this.getSpecIndex()}_${this.getMarks().length}`,
      morphElementKey: spec.morph?.morphElementKey ?? config.morphElementKey
    };

    m.setMarkConfig(markConfig);

    // 8. 初始化样式
    this.initMarkStyleWithSpec(m, mergeSpec({}, themeSpec, markSpec || spec[m.name]));
  }
  return m;
}
Extended Primitive Initialization
protected _initExtensionMark(options: { hasAnimation: boolean; depend?: IMark[] }) {
  if (!this._spec.extensionMark) {
    return;
  }

  const mainMarks = this.getMarksWithoutRoot();
  options.depend = mainMarks;

  // 创建扩展图元
  this._spec.extensionMark?.forEach((m, i) => {
    this._createExtensionMark(
      m,
      null,
      this._getExtensionMarkNamePrefix(),
      i,
      options
    );
  });
}

private _createExtensionMark(
  spec: IExtensionMarkSpec<Exclude<EnableMarkType, 'group'>> | IExtensionGroupMarkSpec,
  parentMark: null | IGroupMark,
  namePrefix: string,
  index: number,
  options: { hasAnimation: boolean; depend?: IMark[] }
) {
  // 1. 创建扩展图元
  const mark = this._createMark(
    {
      type: spec.type,
      name: isValid(spec.name) ? `${spec.name}` : `${namePrefix}_${index}`
    },
    {
      skipBeforeLayouted: true,
      markSpec: spec,
      parent: parentMark,
      dataView: false,
      componentType: spec.componentType,
      depend: options.depend,
      key: spec.dataKey
    },
    {
      setCustomizedShape: spec?.customShape
    }
  ) as IGroupMark;

  if (!mark) {
    return;
  }

  // 2. 设置用户ID
  if (isValid(spec.id)) {
    mark.setUserId(spec.id);
  }

  // 3. 设置动画
  if (options.hasAnimation) {
    const config = animationConfig(
      {},
      userAnimationConfig(spec.type, spec as any, this._markAttributeContext)
    );
    mark.setAnimationConfig(config);
  }

  // 4. 处理子图元
  if (spec.type === 'group') {
    namePrefix = `${namePrefix}_${index}`;
    spec.children?.forEach((s, i) => {
      this._createExtensionMark(s as any, mark, namePrefix, i, options);
    });
  }
  // 5. 设置数据视图
  else if (!parentMark && (!isNil(spec.dataId) || !isNil(spec.dataIndex))) {
    const dataView = this._option.getSeriesData(spec.dataId, spec.dataIndex);
    if (dataView === this._rawData) {
      mark.setDataView(this.getViewData(), this.getViewDataProductId());
    } else {
      mark.setDataView(dataView);
      dataView.target.addListener('change', () => {
        mark.getData().updateData();
      });
    }
  }
}
3.2.4 Relationship between Series and
Region is an important concept in VChart, representing an area in the chart used to organize and layout different chart components. Each Region can contain multiple Series and is responsible for managing the layout and rendering of these Series.
Series use the information of the Region to layout:
// packages/vchart/src/series/base/base-series.ts
export abstract class BaseSeries<T extends ISeriesSpec> extends BaseModel<T> implements ISeries {
  // Region 引用
  protected _region: IRegion = null as unknown as IRegion;

  // 获取关联的 Region
  getRegion(): IRegion {
    return this._region;
  }

  // 构造函数中设置 Region
  constructor(spec: T, options: ISeriesOption) {
    super(spec, options);
    this._region = options.region;
    this._dataSet = options.dataSet;
    this._spec?.name && (this.name = this._spec.name);
  }

  // 获取布局起始点
  getLayoutStartPoint(): ILayoutPoint {
    return this._region.getLayoutStartPoint();
  }

  // 获取布局矩形
  getLayoutRect: () => ILayoutRect = () => {
    return {
      width: this._layoutRect.width ?? this._region.getLayoutRect().width,
      height: this._layoutRect.height ?? this._region.getLayoutRect().height
    };
  };
}
Region can add or remove Series \r\n\r
// packages/vchart/src/region/base/base-region.ts
export abstract class BaseRegion extends BaseModel implements IRegion {
  protected _series: ISeries[] = [];
  protected _groupMark: IGroupMark;

  // 添加系列
  addSeries(series: ISeries): void {
    this._series.push(series);
  }

  // 移除系列
  removeSeries(series: ISeries): void {
    const index = this._series.indexOf(series);
    if (index > -1) {
      this._series.splice(index, 1);
    }
  }

  // 获取所有系列
  getSeries(): ISeries[] {
    return this._series;
  }

  // 获取区域组图元
  getGroupMark(): IGroupMark {
    return this._groupMark;
  }

  // 等待所有系列过滤完成
  async waitAllSeriesFilterOver(): Promise<void> {
    const promises = this._series.map(series => {
      return new Promise<void>(resolve => {
        series.event.on(
          ChartEvent.viewDataFilterOver,
          { filter: ({ model }) => model?.id === series.id },
          () => resolve()
        );
      });
    });
    await Promise.all(promises);
  }
}
3.3 Chart Assembly
3.3.1 How to Implement a Bar Chart
First, we create a BarChart instance:
// packages/vchart/src/chart/bar/bar.ts
export class BarChart<T extends IBarChartSpec = IBarChartSpec> extends BaseChart<T> {
  static readonly type: string = ChartTypeEnum.bar;
  static readonly seriesType: string = SeriesTypeEnum.bar;
  static readonly transformerConstructor = BarChartSpecTransformer;
  readonly transformerConstructor = BarChartSpecTransformer;
  readonly type: string = ChartTypeEnum.bar;
  readonly seriesType: string = SeriesTypeEnum.bar;
}

// 注册 Bar Chart
export const registerBarChart = () => {
  registerBarSeries();
  Factory.registerChart(BarChart.type, BarChart);
};
Then it will trigger the constructor of BaseChart
// packages/vchart/src/chart/base/base-chart.ts
constructor(spec: T, option: IChartOption) {
  super(option);
  this._paddingSpec = normalizeLayoutPaddingSpec(spec.padding ?? option.getTheme().padding);
  this._event = new Event(option.eventDispatcher, option.mode);
  this._dataSet = option.dataSet;
  this._chartData = new ChartData(this._dataSet);
  // ... 其他初始化
}
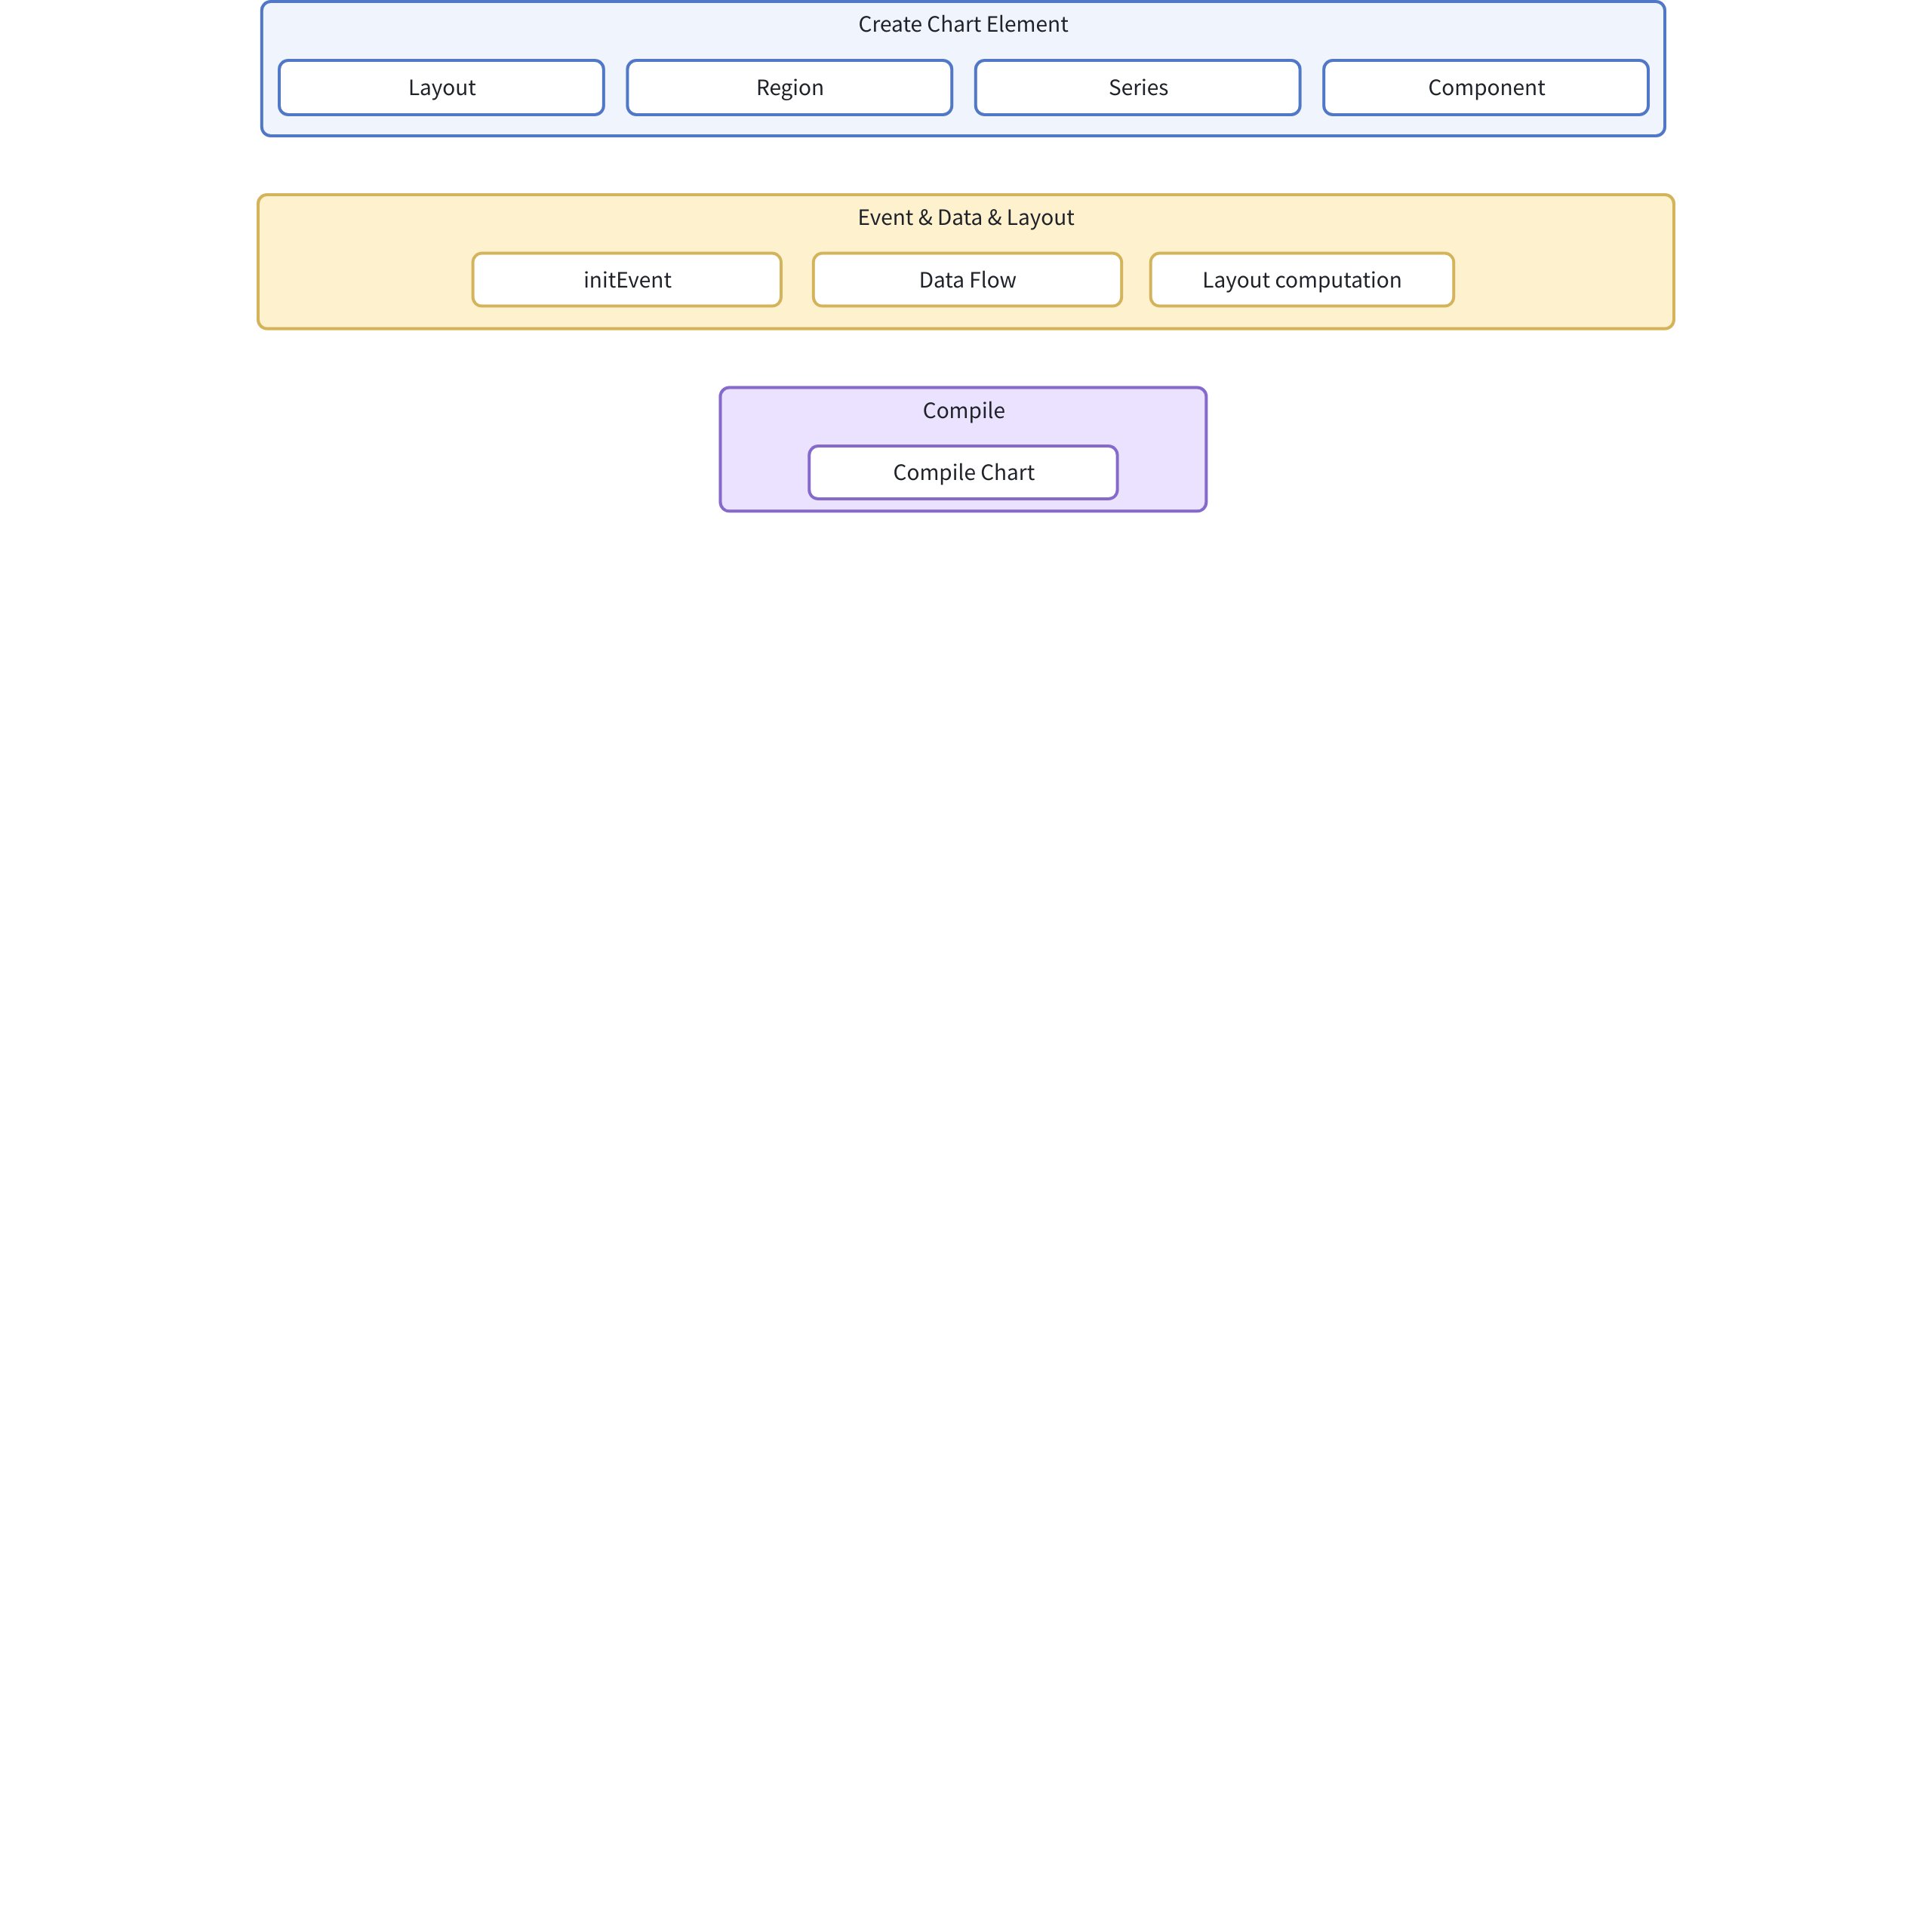
Create Element
Layout
private _createLayout() {
  this._updateLayoutRect(this._viewBox);
  this._initLayoutFunc();
}

private _initLayoutFunc() {
  this._layoutFunc = this._option.layout;
  if (!this._layoutFunc) {
    const constructor = Factory.getLayoutInKey(this._spec.layout?.type ?? 'base');
    if (constructor) {
      const layout = new constructor(this._spec.layout, {
        onError: this._option?.onError
      });
      this._layoutFunc = layout.layoutItems.bind(layout);
    }
  }
}
Create Region and Series
protected _createRegion(constructor: IRegionConstructor, specInfo: IModelSpecInfo) {
  if (!constructor) return;
  const { spec, ...others } = specInfo;
  const region = new constructor(spec, {
    ...this._modelOption,
    ...others
  });
  if (region) {
    region.created();
    this._regions.push(region);
  }
}

protected _createSeries(constructor: ISeriesConstructor, specInfo: IModelSpecInfo) {
  if (!constructor) return;
  const { spec, ...others } = specInfo;

  // 获取对应的区域
  let region: IRegion | undefined;
  if (isValid(spec.regionId)) {
    region = this.getRegionsInUserId(spec.regionId);
  } else if (isValid(spec.regionIndex)) {
    region = this.getRegionsInIndex([spec.regionIndex])[0];
  }

  if (!region && !(region = this._regions[0])) return;

  // 创建系列
  const series = new constructor(spec, {
    ...this._modelOption,
    ...others,
    type: spec.type,
    region,
    globalScale: this._globalScale,
    sourceDataList: this._chartData.dataList
  });

  if (series) {
    series.created();
    this._series.push(series);
    region.addSeries(series);
  }
}
Create Component
  protected _createComponent(constructor: IComponentConstructor, specInfo: IModelSpecInfo) {
    const component = constructor.createComponent(specInfo, {
      ...this._modelOption,
      type: constructor.type,
      getAllRegions: this.getAllRegions,
      getRegionsInIndex: this.getRegionsInIndex,
      getRegionsInIds: this.getRegionsInIds,
      getRegionsInUserIdOrIndex: this.getRegionsInUserIdOrIndex,
      getAllSeries: this.getAllSeries,
      getSeriesInIndex: this.getSeriesInIndex,
      getSeriesInIds: this.getSeriesInIds,
      getSeriesInUserIdOrIndex: this.getSeriesInUserIdOrIndex,
      getAllComponents: this.getComponents,
      getComponentByIndex: this.getComponentByIndex,
      getComponentByUserId: this.getComponentByUserId,
      getComponentsByKey: this.getComponentsByKey,
      getComponentsByType: this.getComponentsByType
    });
    if (!component) {
      return;
    }
    component.created();
    this._components.push(component);
  }
Other Parts Besides Chart Visual Elements
Initialization Event
  private _initEvent() {
    [ChartEvent.dataZoomChange, ChartEvent.scrollBarChange].forEach(event => {
      this._event.on(event, ({ value }) => {
        this._disableMarkAnimation(['exit', 'update']);
        const enableMarkAnimate = () => {
          this._enableMarkAnimation(['exit', 'update']);
          this._event.off(VGRAMMAR_HOOK_EVENT.AFTER_MARK_RENDER_END, enableMarkAnimate);
        };
        this._event.on(VGRAMMAR_HOOK_EVENT.AFTER_MARK_RENDER_END, enableMarkAnimate);
      });
    });
  }
Data Stream Processing
reDataFlow() {
  this._series.forEach(s => s.getRawData()?.markRunning());
  this._series.forEach(s => s.fillData());
  this.updateGlobalScaleDomain();
}
Layout Calculation
layout(params: ILayoutParams): void {
  if (this.getLayoutTag()) {
    this._event.emit(ChartEvent.layoutStart, { chart: this });
    this.onLayoutStart(params);
    const elements = this.getLayoutElements();
    this._layoutFunc(this, elements, this._layoutRect, this._viewBox);
    this._event.emit(ChartEvent.afterLayout, { elements, chart: this });
    this.setLayoutTag(false);
    this.onLayoutEnd(params);
    this._event.emit(ChartEvent.layoutEnd, { chart: this });
  }
}
Compile Rendering
compile() {
  this.compileBackground();
  this.compileLayout();
  this.compileRegions();
  this.compileSeries();
  this.compileComponents();
}

compileSeries() {
  this._option.performanceHook?.beforeSeriesCompile?.();
  this.getAllSeries().forEach(s => {
    s.compile();
  });
  this._option.performanceHook?.afterSeriesCompile?.();
}
3.3.2 Common chart
Common Chart is a general chart type in VChart, which allows users to combine multiple different types of series in one chart. Let me analyze its implementation in detail.
Create adaptive series type
// packages/vchart/src/chart/common/common.ts
export class CommonChart<T extends ICommonChartSpec = ICommonChartSpec> extends BaseChart<AdaptiveSpec<T, 'series'>> {
  static readonly type: string = ChartTypeEnum.common;
  static readonly transformerConstructor = CommonChartSpecTransformer;
  readonly transformerConstructor = CommonChartSpecTransformer;
  readonly type: string = ChartTypeEnum.common;
}
AdaptiveSpec<T, 'series'>, allows Common Chart to accept any type of series configuration.
Series Registration Mechanism
// packages/vchart/src/core/factory.ts
export class Factory {
  private static _seriesMap: Map<string, ISeriesConstructor> = new Map();

  static registerSeries(type: string, constructor: ISeriesConstructor) {
    this._seriesMap.set(type, constructor);
  }

  static getSeries(type: string): ISeriesConstructor {
    return this._seriesMap.get(type);
  }
}
Common Chart achieves dynamic series registration through the Factory pattern, allowing Common Chart to register multiple series.
Special Handling of Series
We need to take a closer look at the following three functions
// packages/vchart/src/chart/common/common-transformer.ts
protected _getDefaultSeriesSpec(spec: AdaptiveSpec<T, 'series'>) {
  const defaultSpec = super._getDefaultSeriesSpec(spec);
  // 删除默认的 data 配置
  delete defaultSpec.data;
  return defaultSpec;
}
The function's purpose is to:
-
Obtain the default configuration of the series
-
Inherit the default configuration of the parent class
-
Remove the default data configuration
-
Reason: In a composite chart, each series needs to decide its own data configuration and cannot use a unified default configuration
protected _transformAxisSpec(spec: AdaptiveSpec<T, 'series'>) {
  if (!spec.axes) return;

  if (!!spec.autoBandSize) {
    spec.series.forEach((series: any, seriesIndex: number) => {
      // 只处理柱状图系列
      if (series.type === 'bar') {
        // 找到对应的坐标轴
        const relatedAxis = this._findBandAxisBySeries(series, seriesIndex, spec.axes);
        if (relatedAxis && !relatedAxis.bandSize && !relatedAxis.maxBandSize && !relatedAxis.minBandSize) {
          // 处理柱状图的宽度配置
          const extend = isObject(series.autoBandSize) ? series.autoBandSize.extend ?? 0 : 0;
          const { barMaxWidth, barMinWidth, barWidth, barGapInGroup } = series;
          this._applyAxisBandSize(relatedAxis, extend, { barMaxWidth, barMinWidth, barWidth, barGapInGroup });
        }
      }
    });
  }
}
The function's purpose is to:
-
Handle the configuration of the axes
-
Specifically handle the width configuration of bar charts
-
When autoBandSize is enabled:
-
Iterate over all series
-
Find the bar chart series
-
Find the corresponding axis
-
Calculate and set the width of the bars
-
Handle the spacing of the bars
transformSpec(spec: AdaptiveSpec<T, 'series'>): void {
  // 1. 调用父类的转换方法
  super.transformSpec(spec);

  // 2. 处理系列配置
  if (spec.series && spec.series.length) {
    const defaultSeriesSpec = this._getDefaultSeriesSpec(spec);
    spec.series.forEach((s: ISeriesSpec) => {
      // 验证系列类型
      if (!this._isValidSeries(s.type)) {
        return;
      }
      // 应用默认配置
      Object.keys(defaultSeriesSpec).forEach(k => {
        if (!(k in s)) {
          s[k] = defaultSeriesSpec[k];
        }
      });
    });
  }

  // 3. 处理坐标轴配置
  if (spec.axes && spec.axes.length) {
    spec.axes.forEach((axis: any) => {
      // 处理坐标轴内边距
      if (get(axis, 'trimPadding')) {
        mergeSpec(axis, getTrimPaddingConfig(this.type, spec));
      }
    });
  }

  // 4. 处理坐标轴的 bandSize 配置
  this._transformAxisSpec(spec);
}
This function is the main entry point for conversion, and its functions include:
-
Calling the conversion method of the parent class
-
Handling series configuration:
-
Obtaining default configuration
-
Validating series type
-
Applying default configuration
-
Handling axis configuration:
-
Handling padding
-
Handling bandSize
These three functions together form the configuration conversion system of Common Chart, mainly solving:
-
Handling of multi-series configuration
-
Handling of special configuration for bar charts
-
Handling of axis configuration
This is the key implementation that distinguishes Common Chart from other chart types.