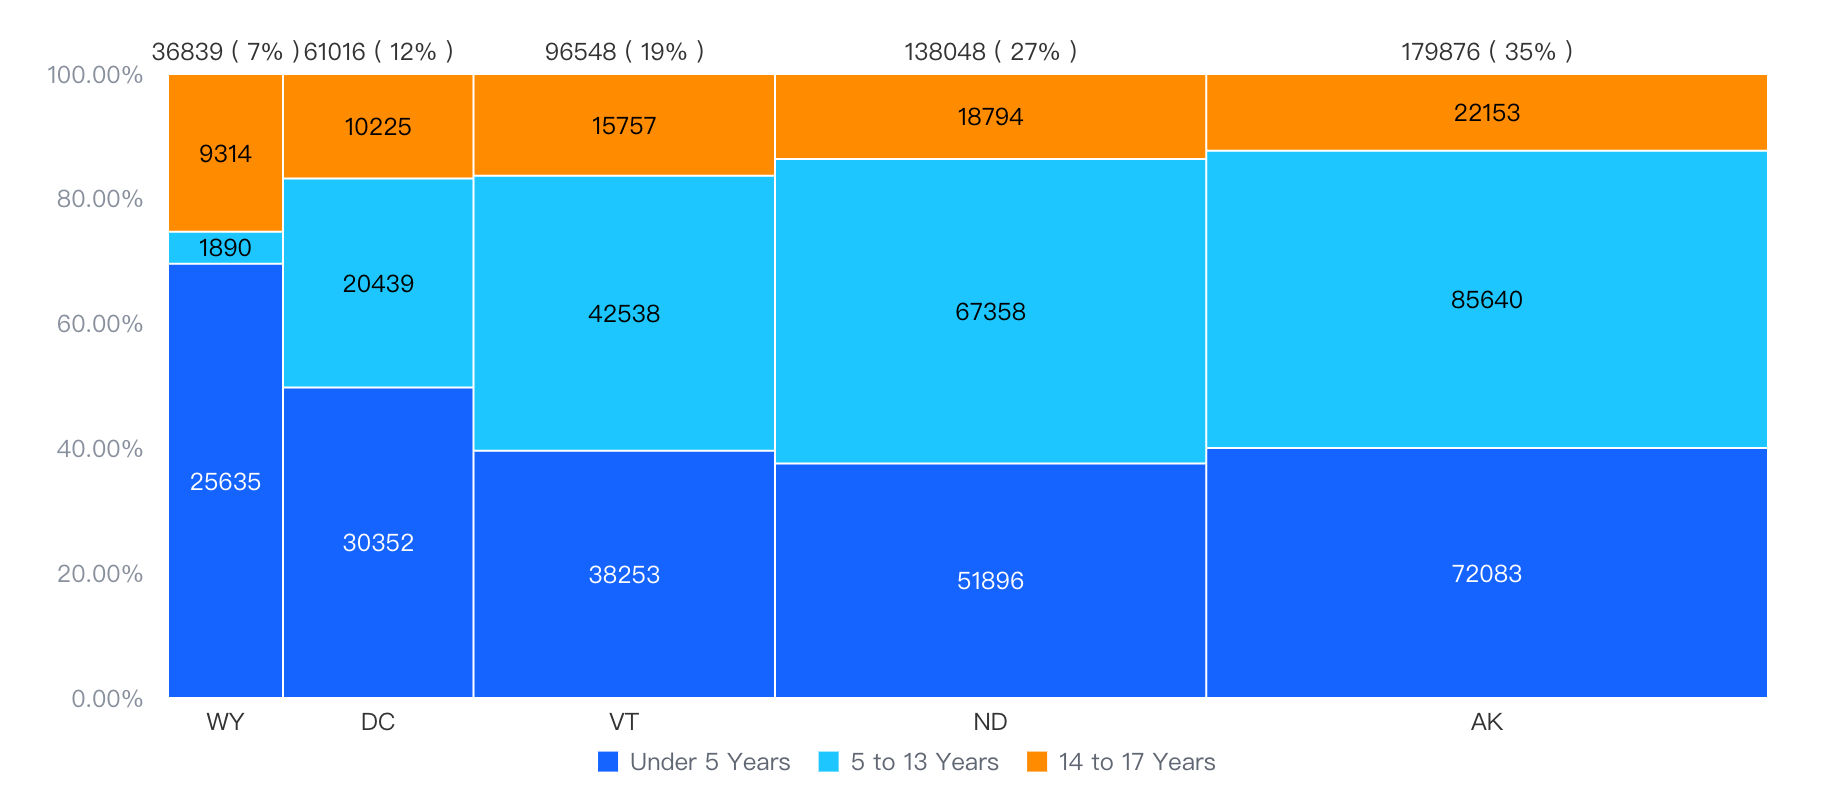
Mosaic chart, also known as Mosaic Plot, is a special type of stacked bar chart that displays data percentages in groups; it is commonly used in the field of statistics.
A 2-dimensional mosaic chart is an extension of the percentage stacked bar chart, showing not only the percentage information within stacked categories but also the percentage distribution between stacked categories.
Chart Components
The configuration of a mosaic chart is similar to that of a bar chart, consisting of rectangular elements, axes, and other components.
Here are some essential configurations:
type: Chart type, set to 'mosaic'
data: Data source for the chart
xField: Categorical field mapping to the x-coordinate / width of the elements
yField: Numeric field mapping to the height / y-coordinate of the elements
Note: Similar to percentage stacked charts, mosaic charts generally do not recommend having negative numbers.
Mosaic Chart without Grouping Fields
When displaying data without grouping fields in a mosaic chart, it defaults to not stacking percentages, but only showing a percentage display of the categorical dimension, which is an extension of the basic bar chart:
Axes
The default configuration of the x-axis for a horizontal mosaic chart is as follows:
The default scale type for the x-axis is linear, with labels not displayed by default. It is recommended to display label values using the label property.