VSeed, an elegant data composer, transforming complexity into simplicity.
!!!###!!!title=Map Label——VisActor/VChart tutorial documents!!!###!!!!!!###!!!description=The scatter map label component is an unconventional map label layout method. The labels are in the form of the [MarkPoint component](/vchart/guide/tutorial_docs/Chart_Concepts/marker), and are laid out around the perimeter of the map as much as possible. Currently, it is only recommended for use with maps of China.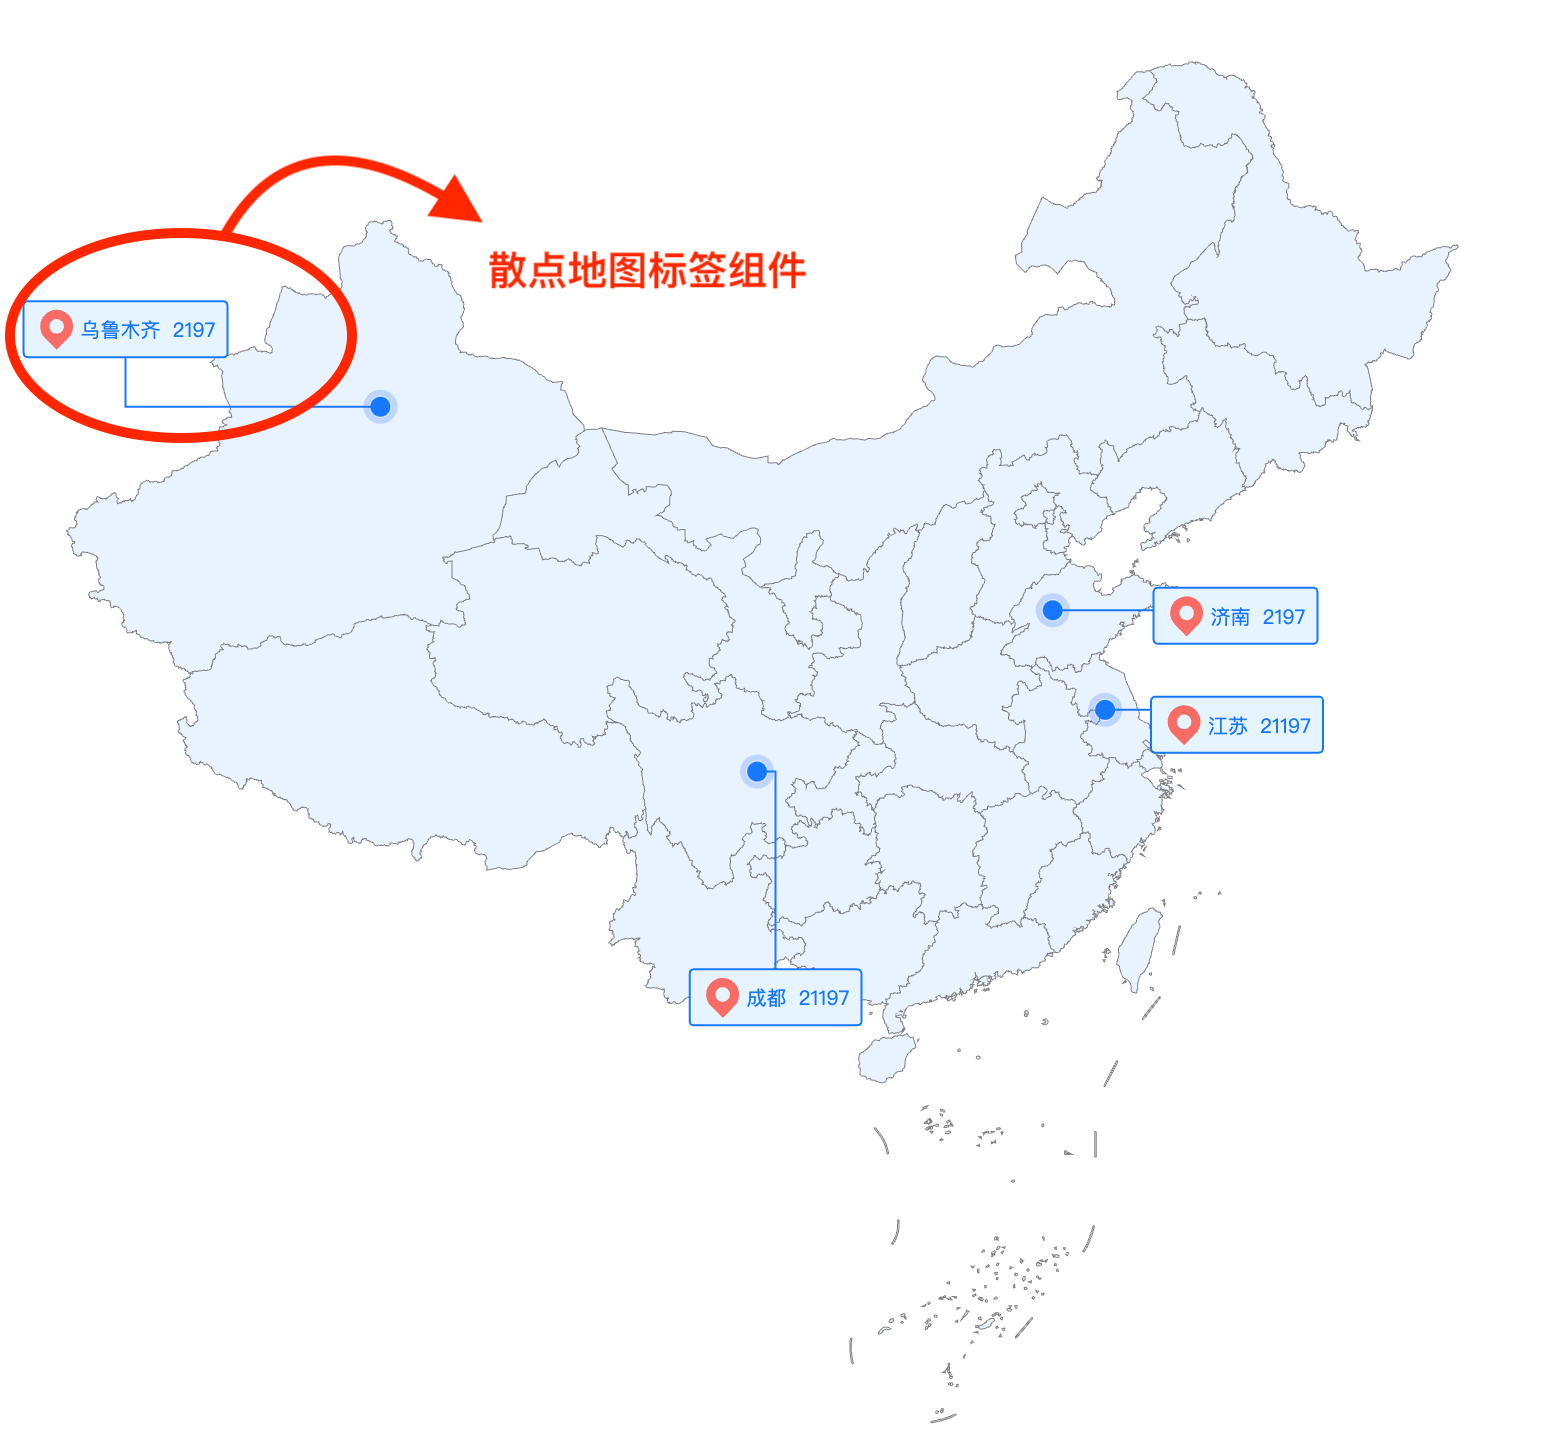!!!###!!!
Map Label Component In Scatter Map
The scatter map label component is an unconventional map label layout method. The labels are in the form of the MarkPoint component, and are laid out around the perimeter of the map as much as possible. Currently, it is only recommended for use with maps of China.
How to Use This Component
The scatter map is supported by default in VChart and can be implemented through the composite chart (Common Chart).
If using the CDN import method, the registration method is as follows:
<scriptsrc="https://cdn.jsdelivr.net/npm/@visactor/vchart/build/index.min.js"></script><scriptsrc="https://cdn.jsdelivr.net/npm/@visactor/vchart-extension/build/index.min.js"></script><script>const spec = {
// your spec };
VChartExtension.registerMapLabel();
const vchart = new VChart.default(spec, { dom: 'chart' });
vchart.renderSync();
</script>
Related Configuration Options
export interface IMapLabelSpec extends IMapLabelStyleSpec {
/** Associated series ID */ seriesId: StringOrNumber;
/** Data field for the name text */ nameField?: string;
/** Data field for the value text */ valueField?: string;
/**
* Interaction trigger type
* @default 'none'
*/ trigger?: 'hover' | 'click' | 'none';
}
export interface IMapLabelStyleSpec {
/**
* Whether to display
* @default false
*/ visible?: boolean;
/**
* The spacing between the label and the marker point when the label position is not 'outer'
* @default 12
*/ offset?: number;
/**
* The distance between the icon and the label
* @default 10
*/ space?: number;
/**
* Label position. Supports 'left' | 'top' | 'right' | 'bottom' | 'outer'
* @default 'top'
*/position?: LabelPosition;
/** Settings for the name text style */ nameLabel?: {
visible?: boolean;
style?: ITextMarkSpec;
};
/** Settings for the value text style */ valueLabel?: {
visible?: boolean;
style?: ITextMarkSpec;
};
/** Icon style settings */icon?: {
visible?: boolean;
style?: ISymbolMarkSpec;
};
/** Background style settings */background?: {
/** @default true */
visible?: boolean;
/** Background frame padding */padding?: IPadding;
style?: IRectMarkSpec;
};
/** Leader line style settings */ leader?: {
visible?: boolean;
style?: IPathMarkSpec;
};
}

