Introduction to VMind
Preface
VisActor is a full-process visualization solution, which takes "visual storytelling" and "intelligence" as its core development direction. The components of VisActor that carry the ability of "visual storytelling" mainly include VChart, VTable, and VGrammar, all of which provide simple and easy-to-use interfaces. However, we hope that in some typical scenarios, users can generate charts and narrative works without writing code, thereby reducing the learning cost and complexity for users. The powerful generation ability of the large language model provides a natural language interaction interface for the VisActor visualization system, allowing us to directly call various functions of visualization components such as VChart and VTable through natural language, thereby completing visualization creation simply, quickly, and with high quality.
VMind is an intelligent visualization component built on the basic capabilities of visualization component libraries such as VChart and VTable. We hope that in some typical scenarios, users can generate charts and narrative works with just one sentence, thereby reducing the learning cost and complexity for users.
VMind Architecture Design
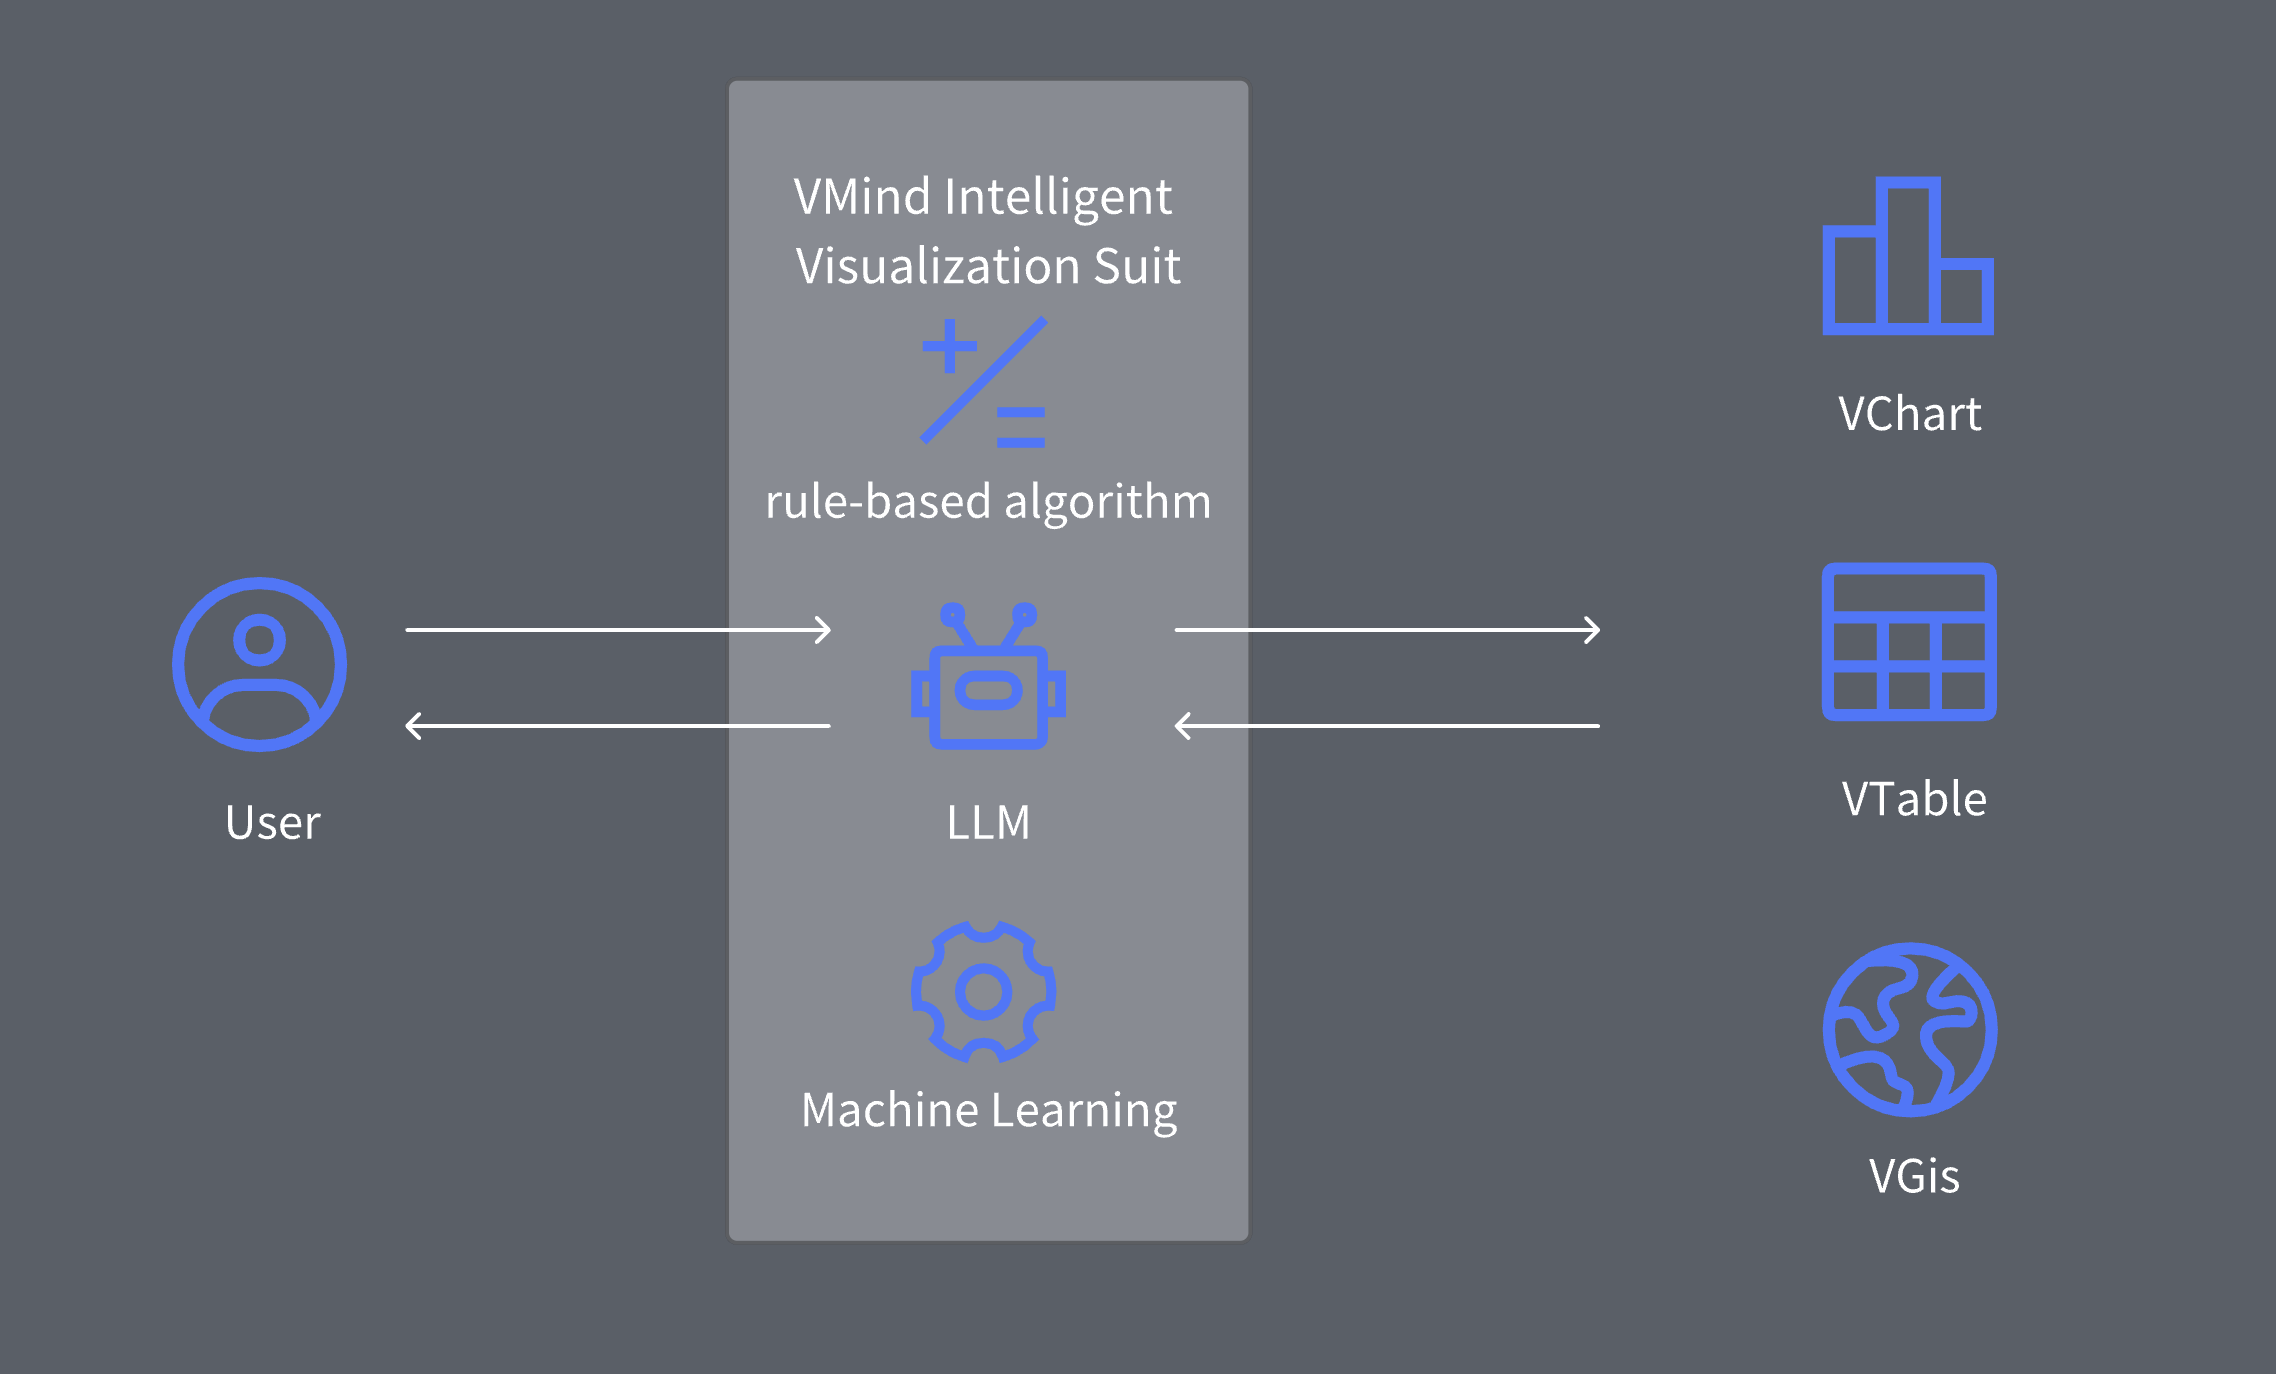
Intelligence is the future core direction of VisActor. Only on this basis can we truly reduce the access and development costs of developers and allow them to focus on things outside of visualization. VMind is an intelligent visualization component in the VisActor system. It provides intelligent interfaces in various ways such as rule algorithms, artificial intelligence, machine learning, and large language models to minimize the mental burden of developers using visualization components.
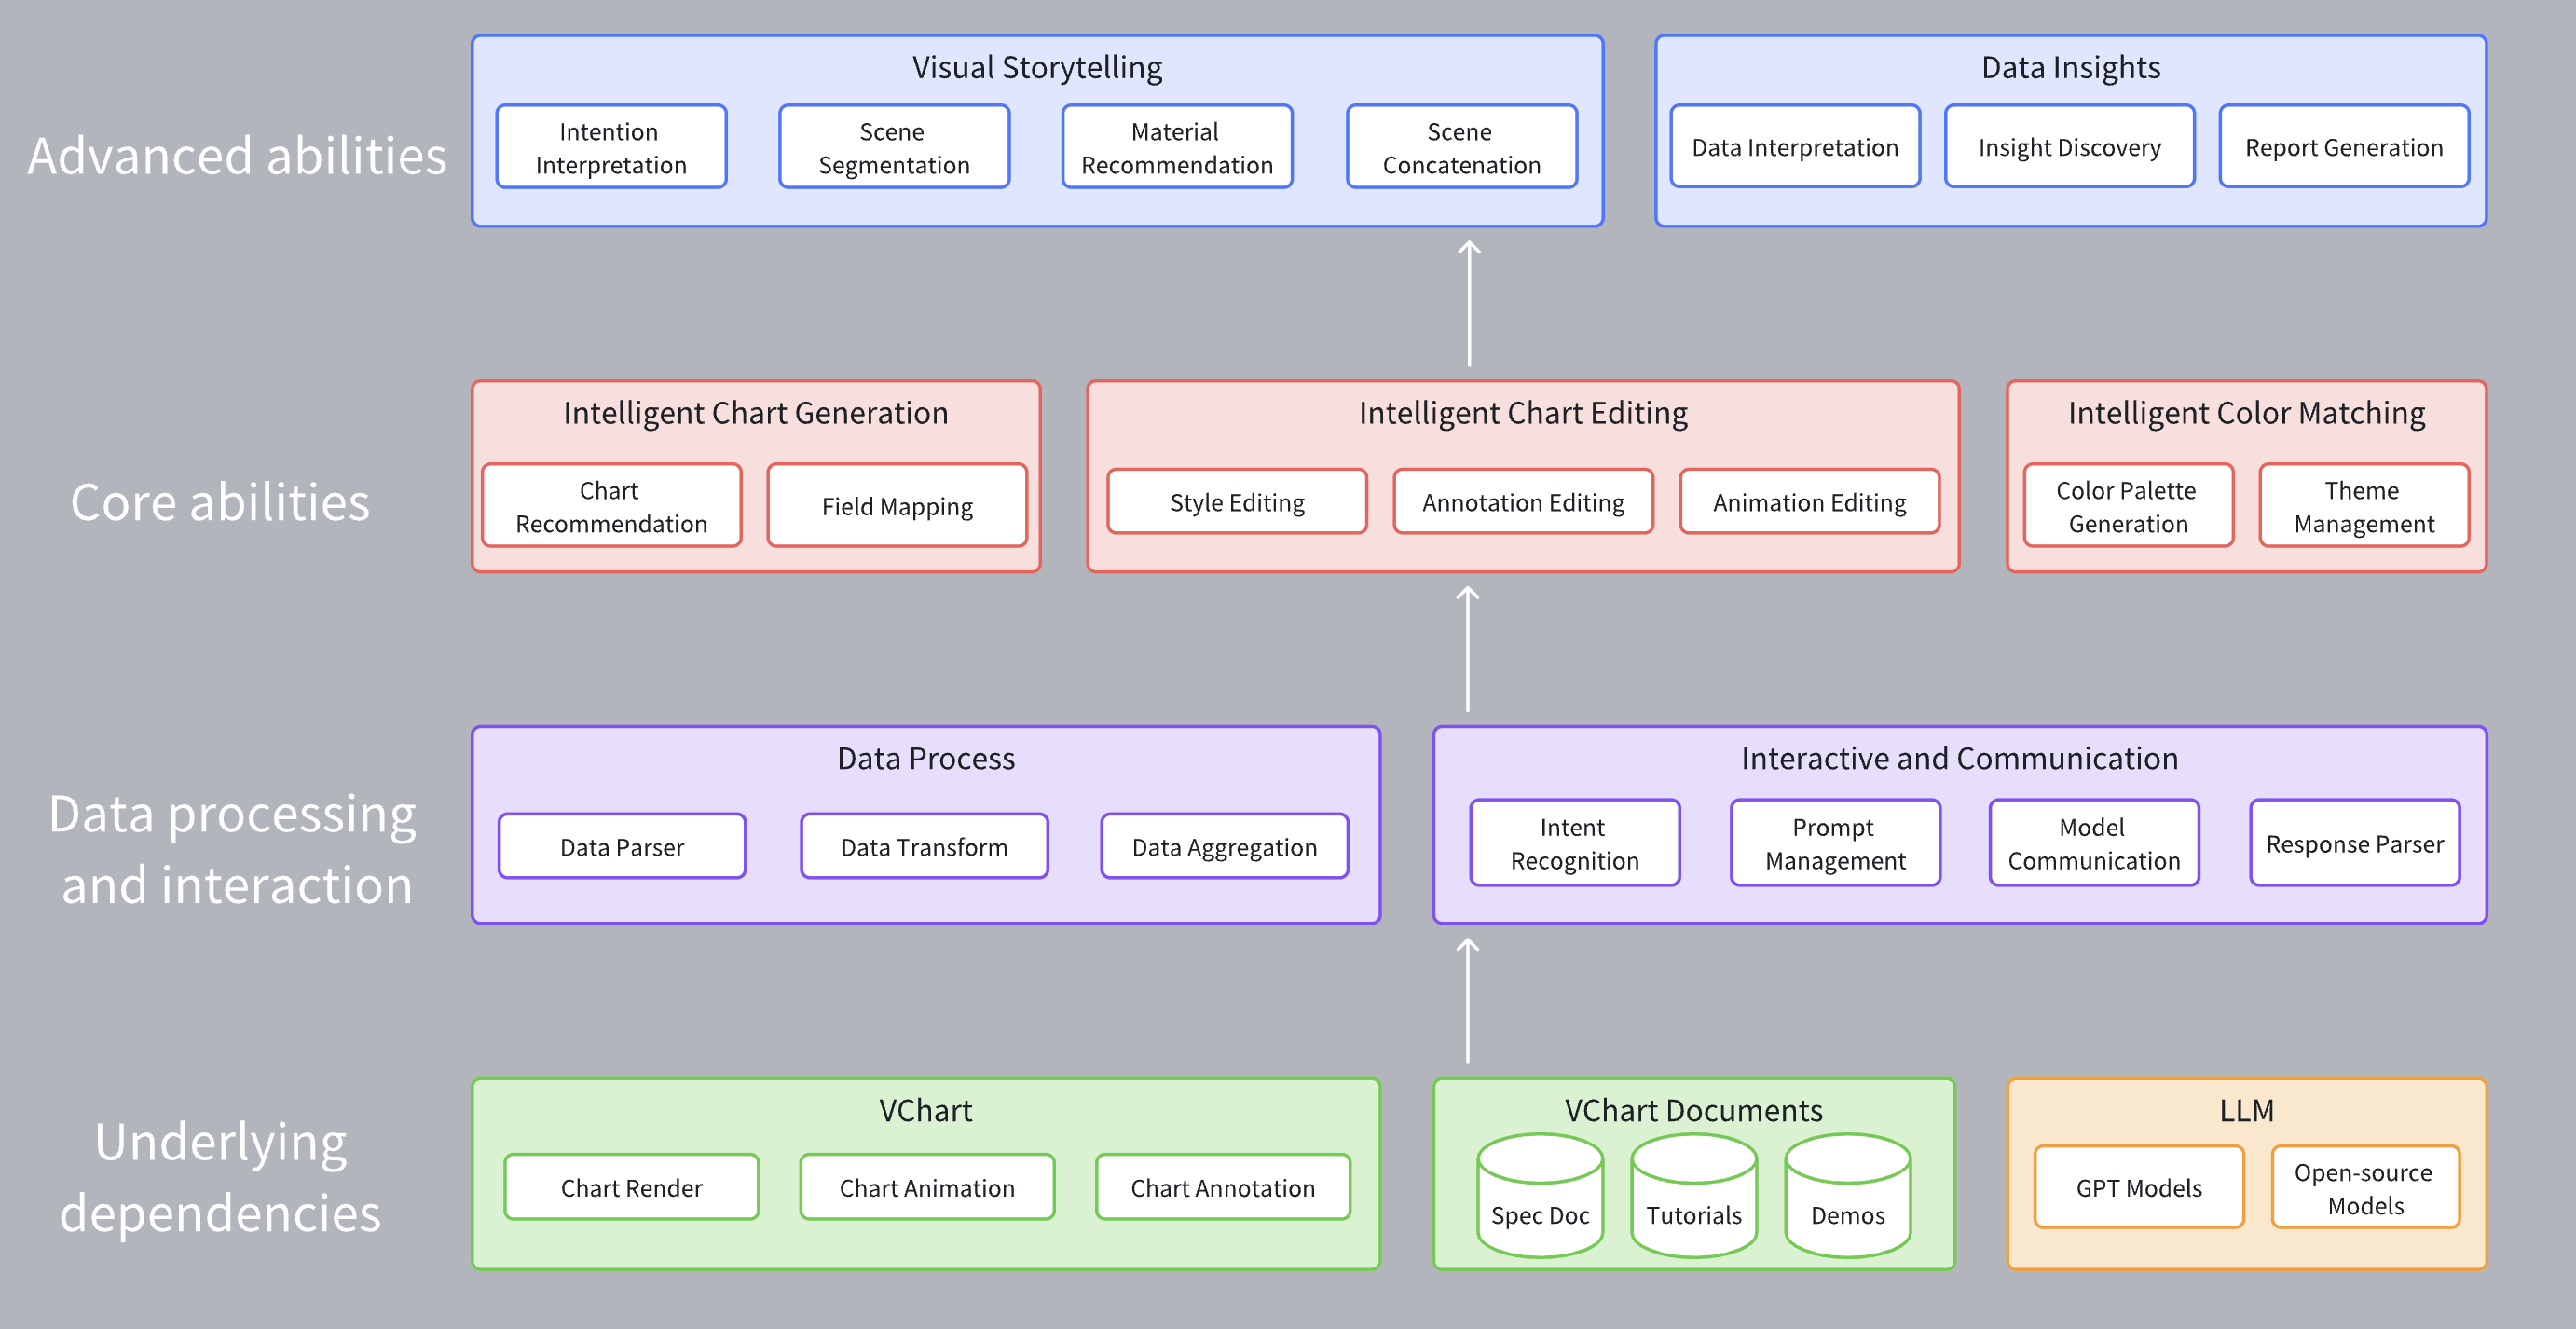
In the VMind component, the bottom layer is the chart rendering, animation, annotation capabilities, VChart documentation provided by the VChart chart library, and the natural language understanding and code generation capabilities provided by the LLM. Among them, the data processing and interaction layer is responsible for processing user input data and natural language, including data aggregation modules for field parsing, data conversion, aggregation, etc., and the interaction communication module is responsible for handling communication between users and VMind, VMind and the LLM, including user intent recognition, Prompt management, model communication, result parsing.
VMind Core Capabilities
The core capabilities of VMind include intelligent chart generation, intelligent chart editing, and intelligent color matching.
- Intelligent chart generation refers to the process of directly generating charts from the display intent + data described in natural language.
- Intelligent chart editing is the process of generating edited charts based on the original chart through the editing intent described in natural language.
- Intelligent color matching is the process of generating stylized charts from natural language.
Advanced capabilities are further applications of core capabilities, including complete visual narrative generation, data interpretation, and insight reports.
VMind Chart Creation Process
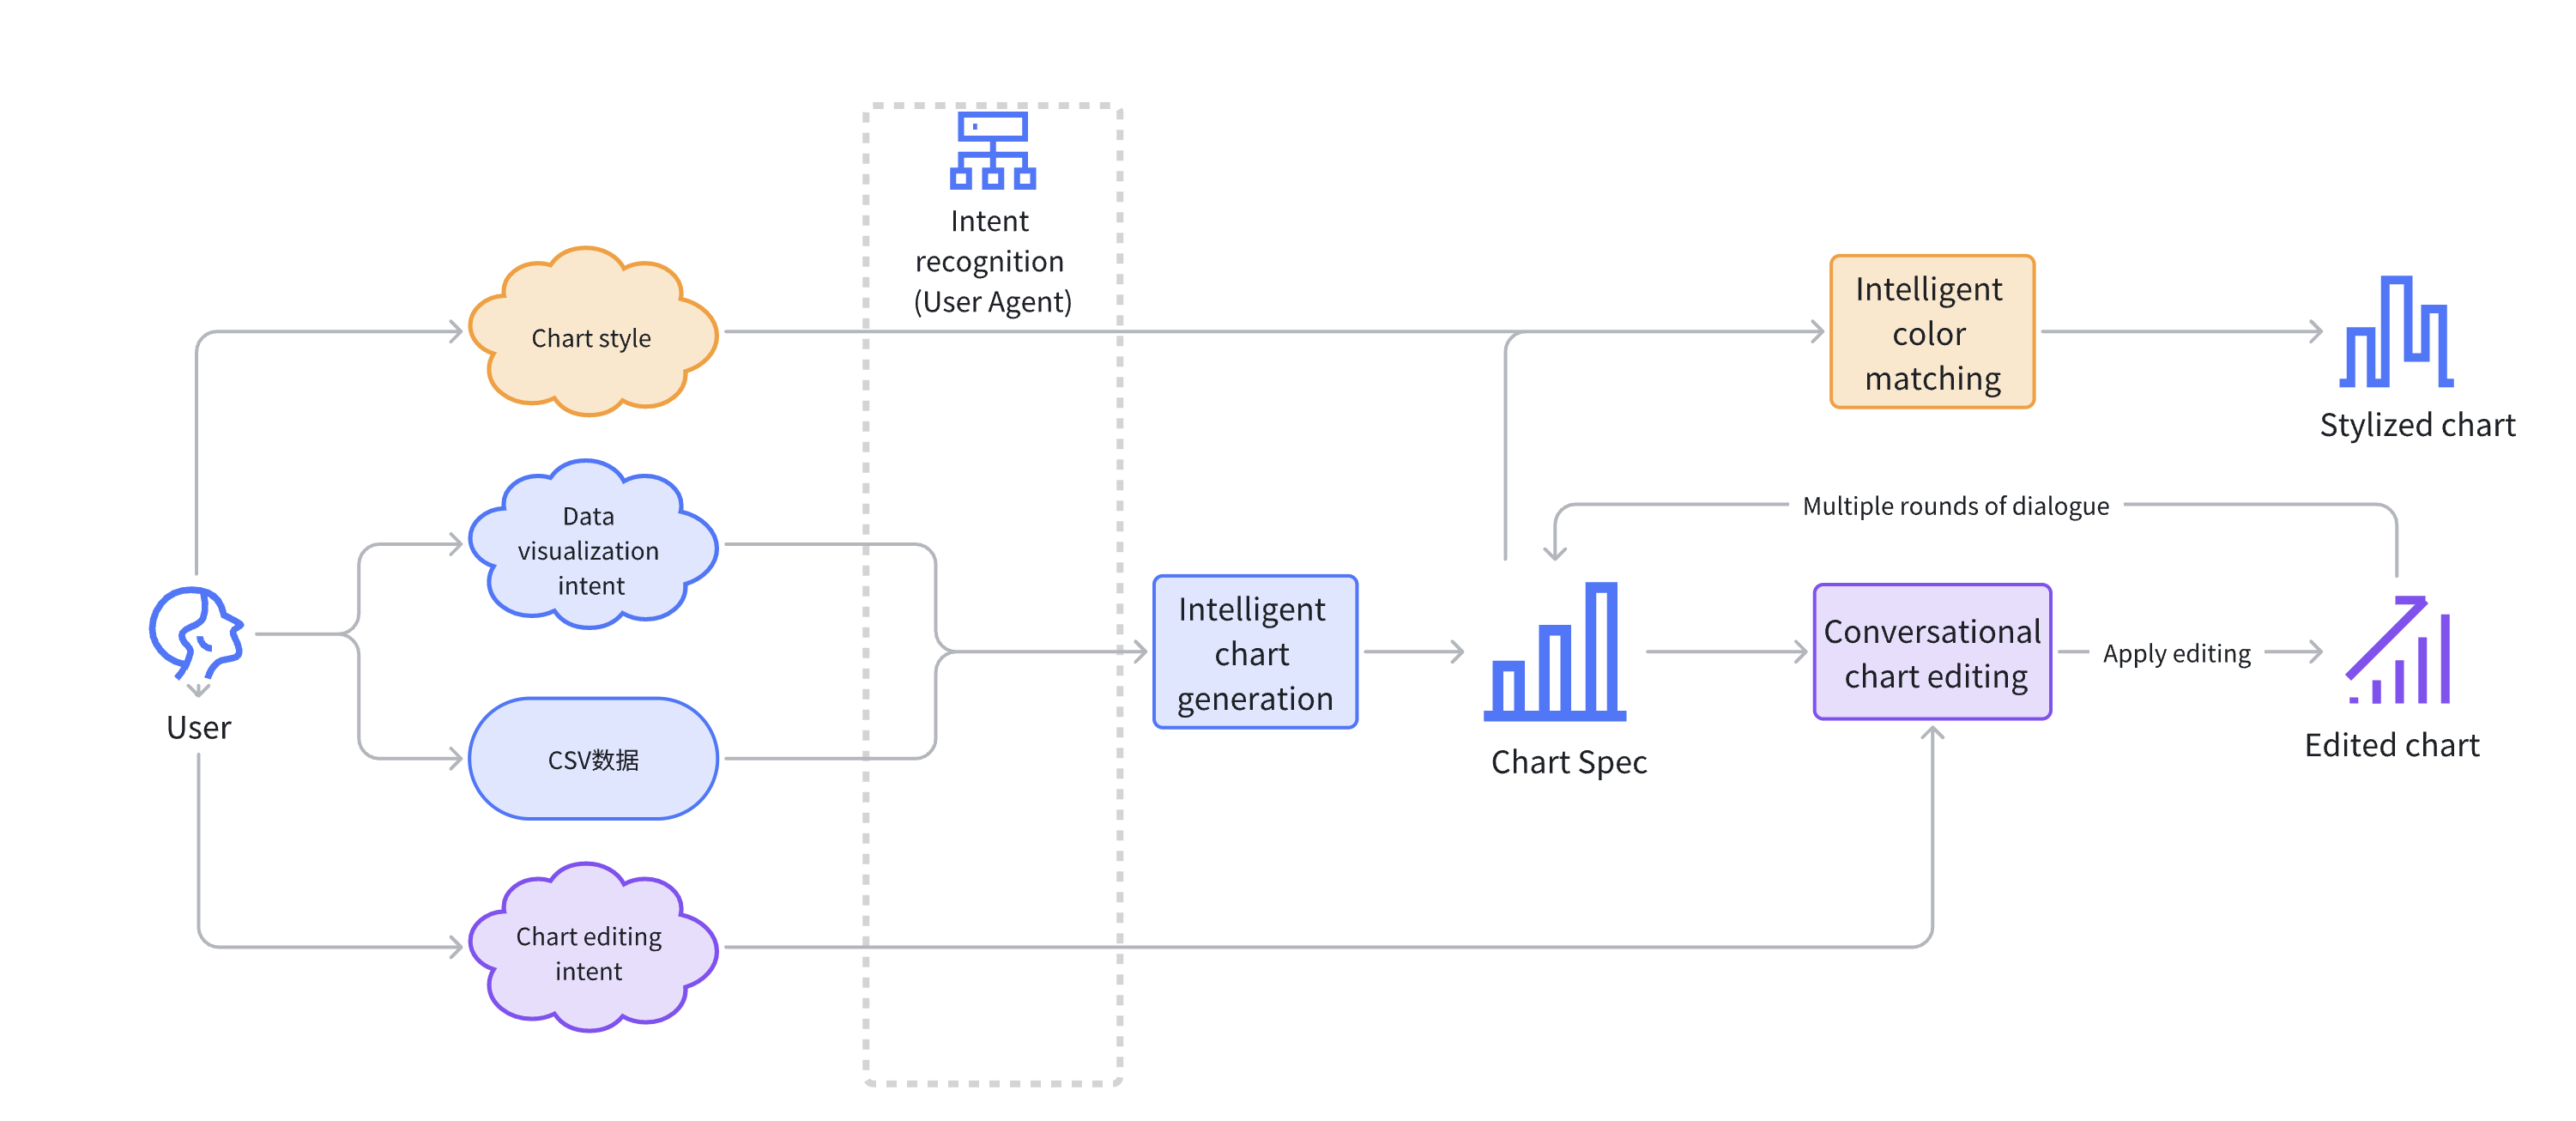
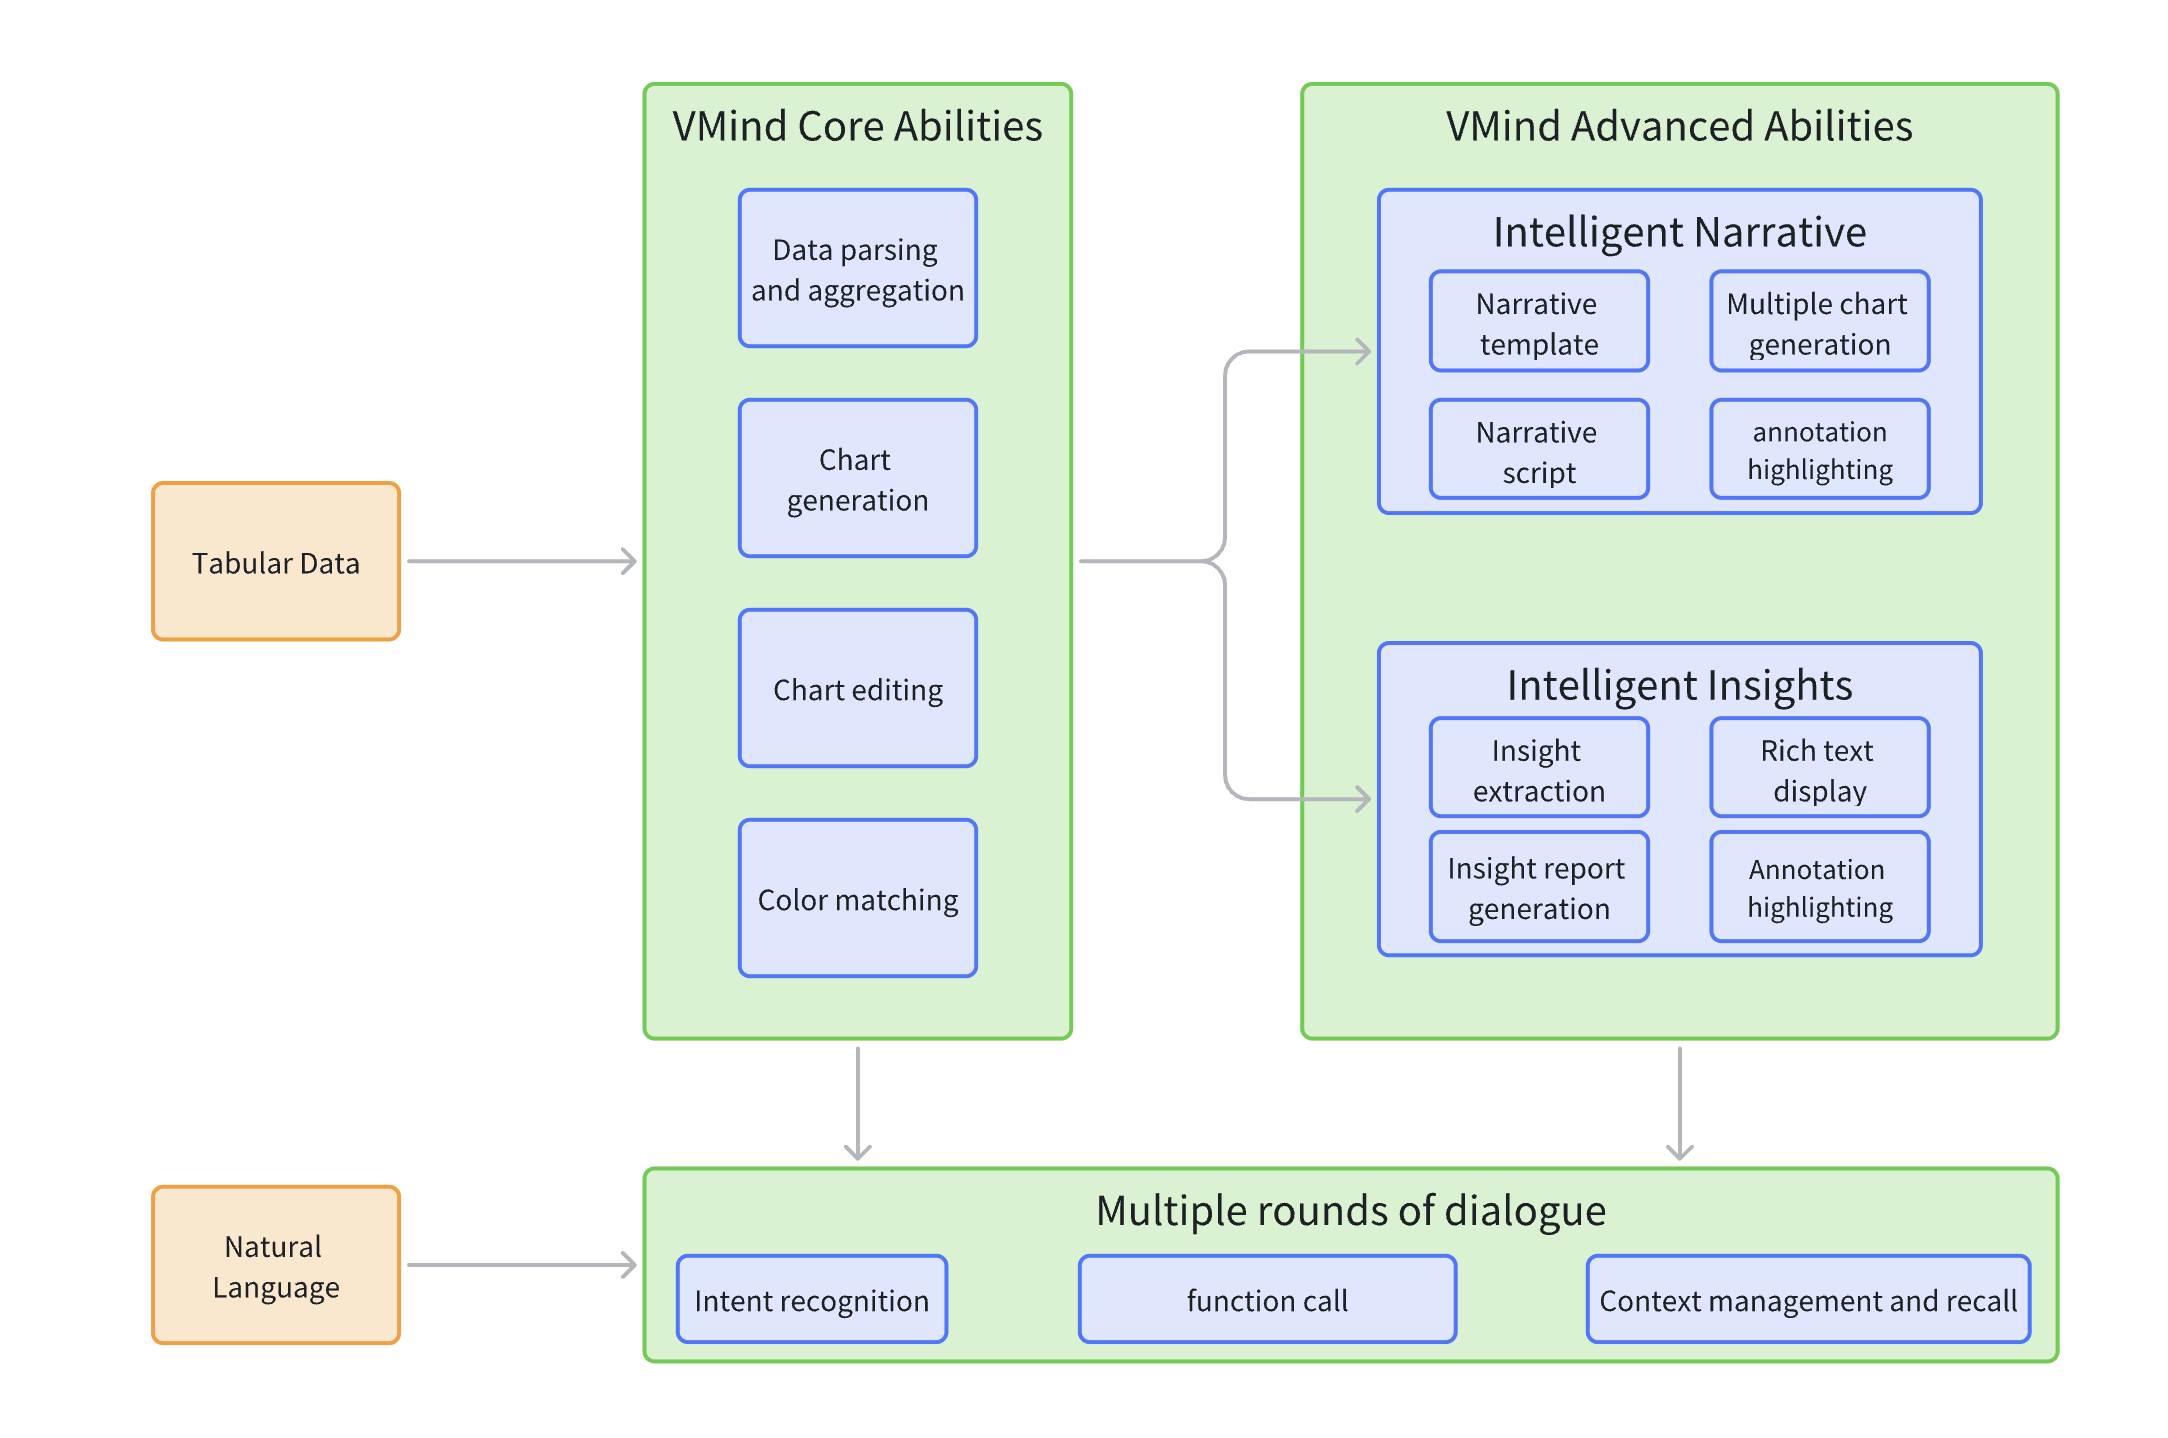
Based on VMind's intelligent chart generation, conversational editing, and intelligent color matching modules, we can summarize the full process of using VMind for chart creation: First, the user provides a natural language description of the data display intent and chart data, or provides a natural language description of the chart editing intent and data news fragments, etc. These inputs are processed by the intent recognition module and routed to different modules. The intelligent chart generation module generates preliminary charts; the intelligent color matching module will generate corresponding theme color palettes according to user input, making the color matching of the chart more harmonious and beautiful; the conversational editing module will repeatedly apply a series of editing operations to fine-tune and optimize the chart until a chart that meets user needs is generated.
The collaboration of these modules allows users to create visualization works without any threshold. This process not only greatly simplifies the complexity of chart creation but also greatly improves the efficiency and quality of chart creation.
This process makes full use of the function call capability of the LLM. Chart generation, chart editing, and intelligent color matching are provided as functions for the model to call. LLM serves as the interface for interacting with users, selects the corresponding function according to user intent, and passes in parameters to execute the function of the corresponding module. In the future, VMind will also integrate insight extraction and data interpretation functions to interpret the generated charts, generate insight reports, or add annotations to the charts to display insight information in the data. At the same time, the model also has a powerful natural language dialogue capability, which can have multiple rounds of dialogue with users, and help users complete the entire process from chart creation to data analysis in a simple, natural, and friendly manner. Developers can easily integrate VMind into their systems as a data visualization assistant.
Practical Application of VMind
Data Video
Data video is a type of video that presents and interprets data content through charts, animations, annotations, voiceovers, etc. This method can transform abstract data into intuitive graphics, present it in a more lively and interesting way, and make it easier for the audience to understand and accept.
The steps to make a data video include:
- Determine the data source and theme
- Collect and organize data
- Create, edit, and export charts
- Video editing In the traditional data video production process, after collecting data, the creator needs to use professional visualization software to convert the data into charts; or use various chart libraries to draw charts through programming and export them as videos. In the era of short videos, everyone can become a video creator. However, non-professional video creators often do not have the skills to visualize data into charts and export them as videos, which greatly increases the threshold for making data videos.
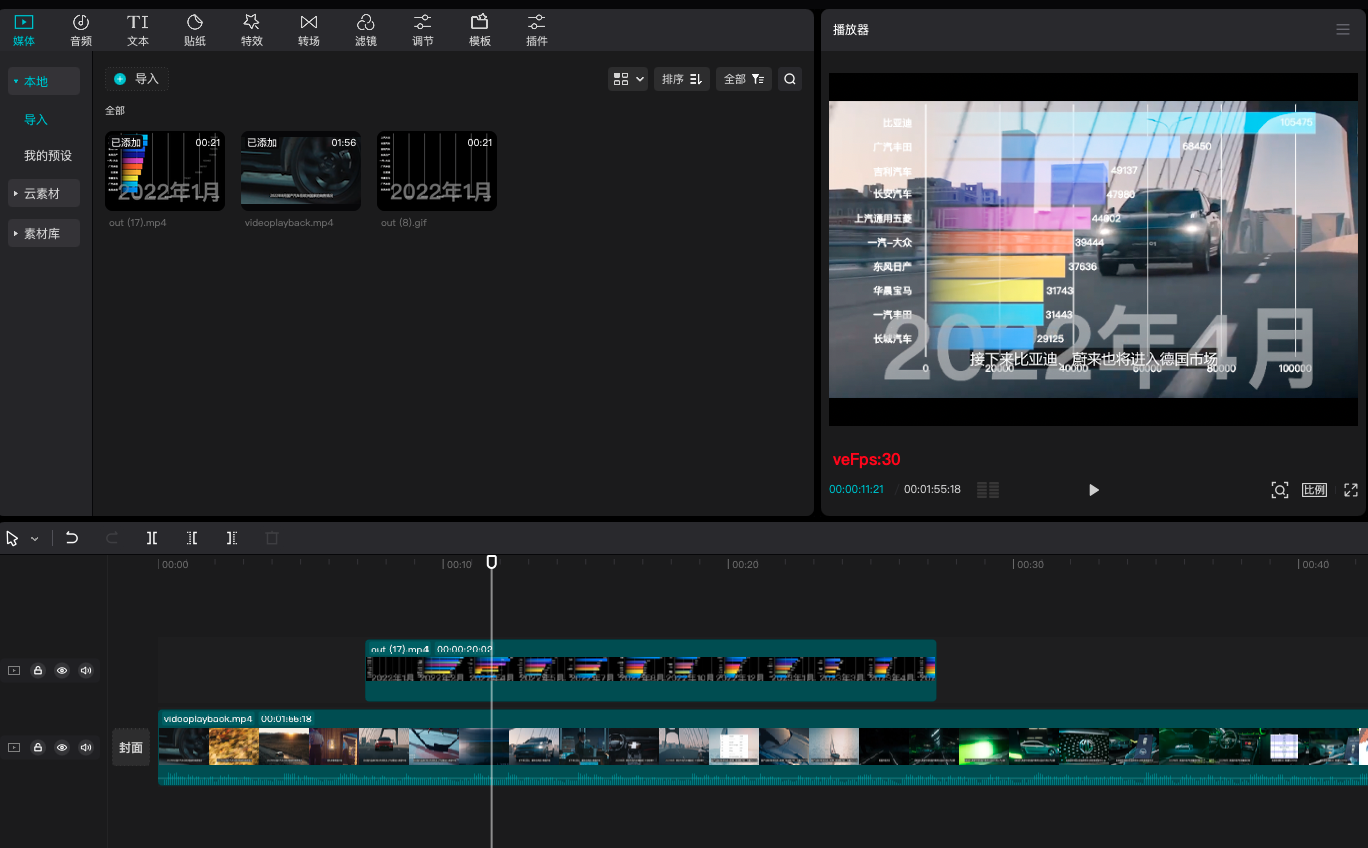
When using VMind to make data videos, users only need to describe the content they want to show in one sentence after collecting the data, and they can directly generate chart animations and support one-click export to videos and GIFs, which greatly reduces the difficulty of making data videos.
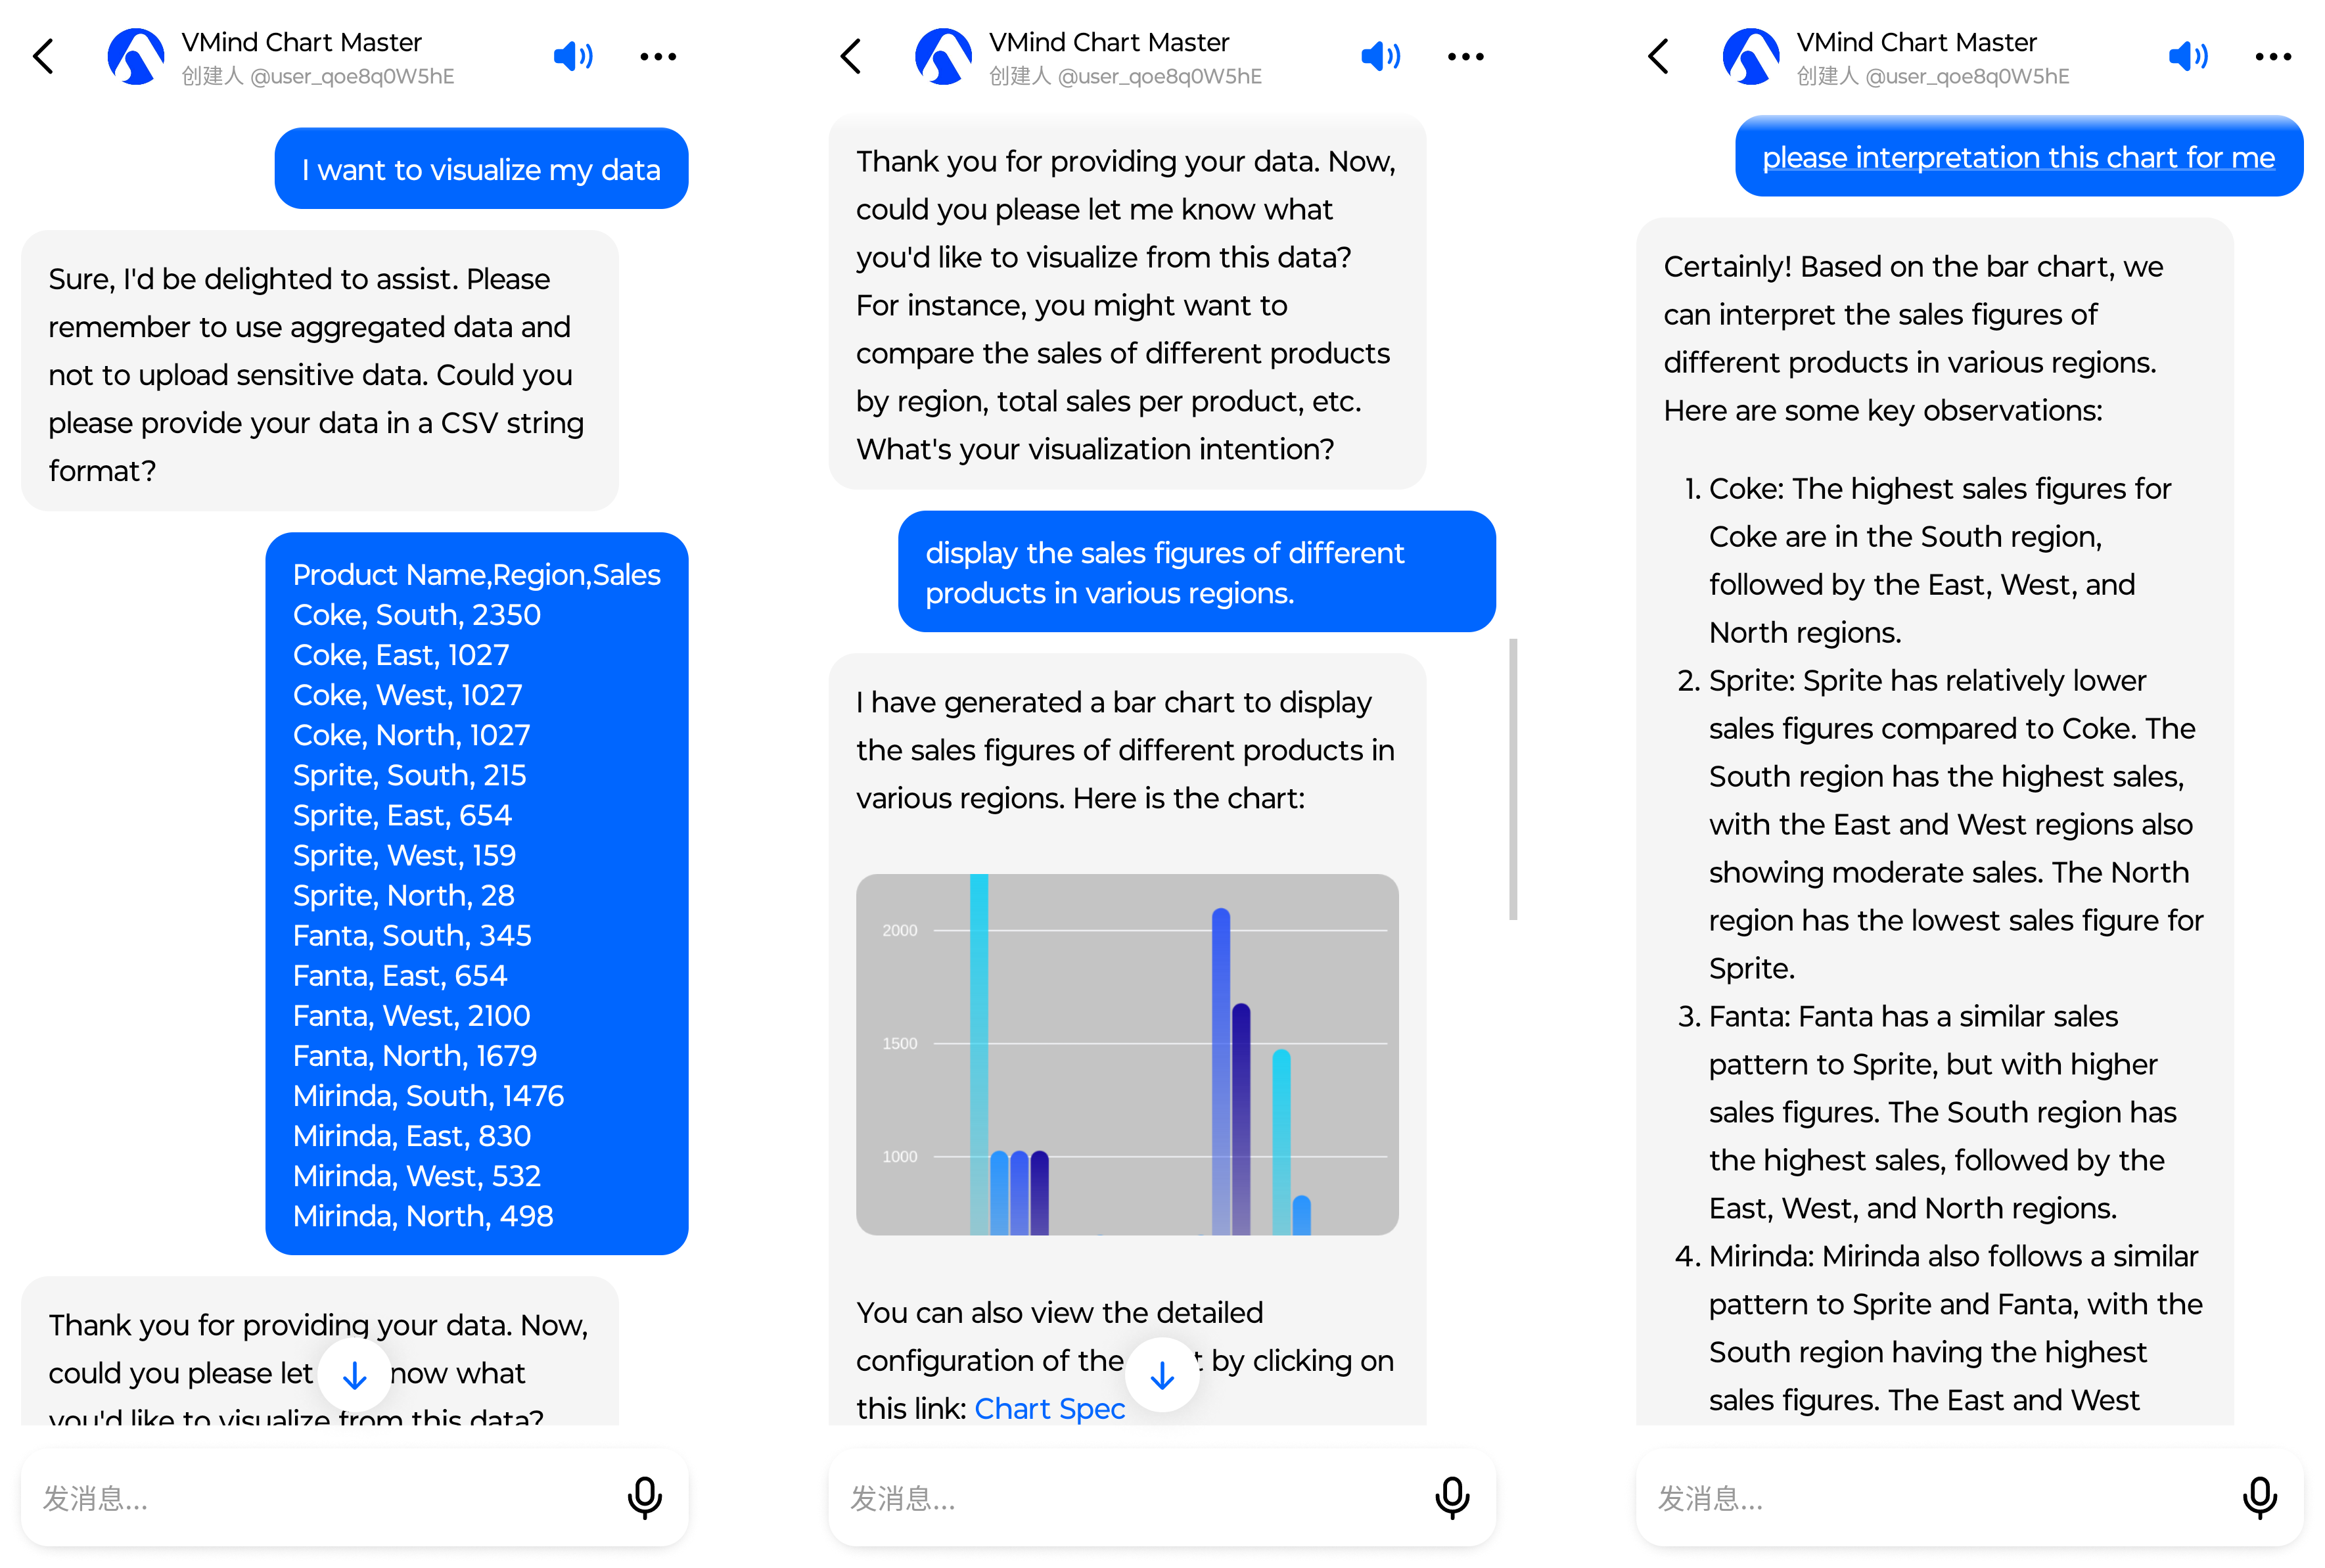
Intelligent Chart Assistant
With the intelligent chart assistant built with VMind, you can use the function call capability of the large language model to judge the user's intent and call the VMind interface to realize chart generation and data interpretation, thereby reducing the difficulty of data visualization.
You can try the VMind Chart Assistant on Cici.