
Title
How to set the background width when interacting with a bar chart?
Description
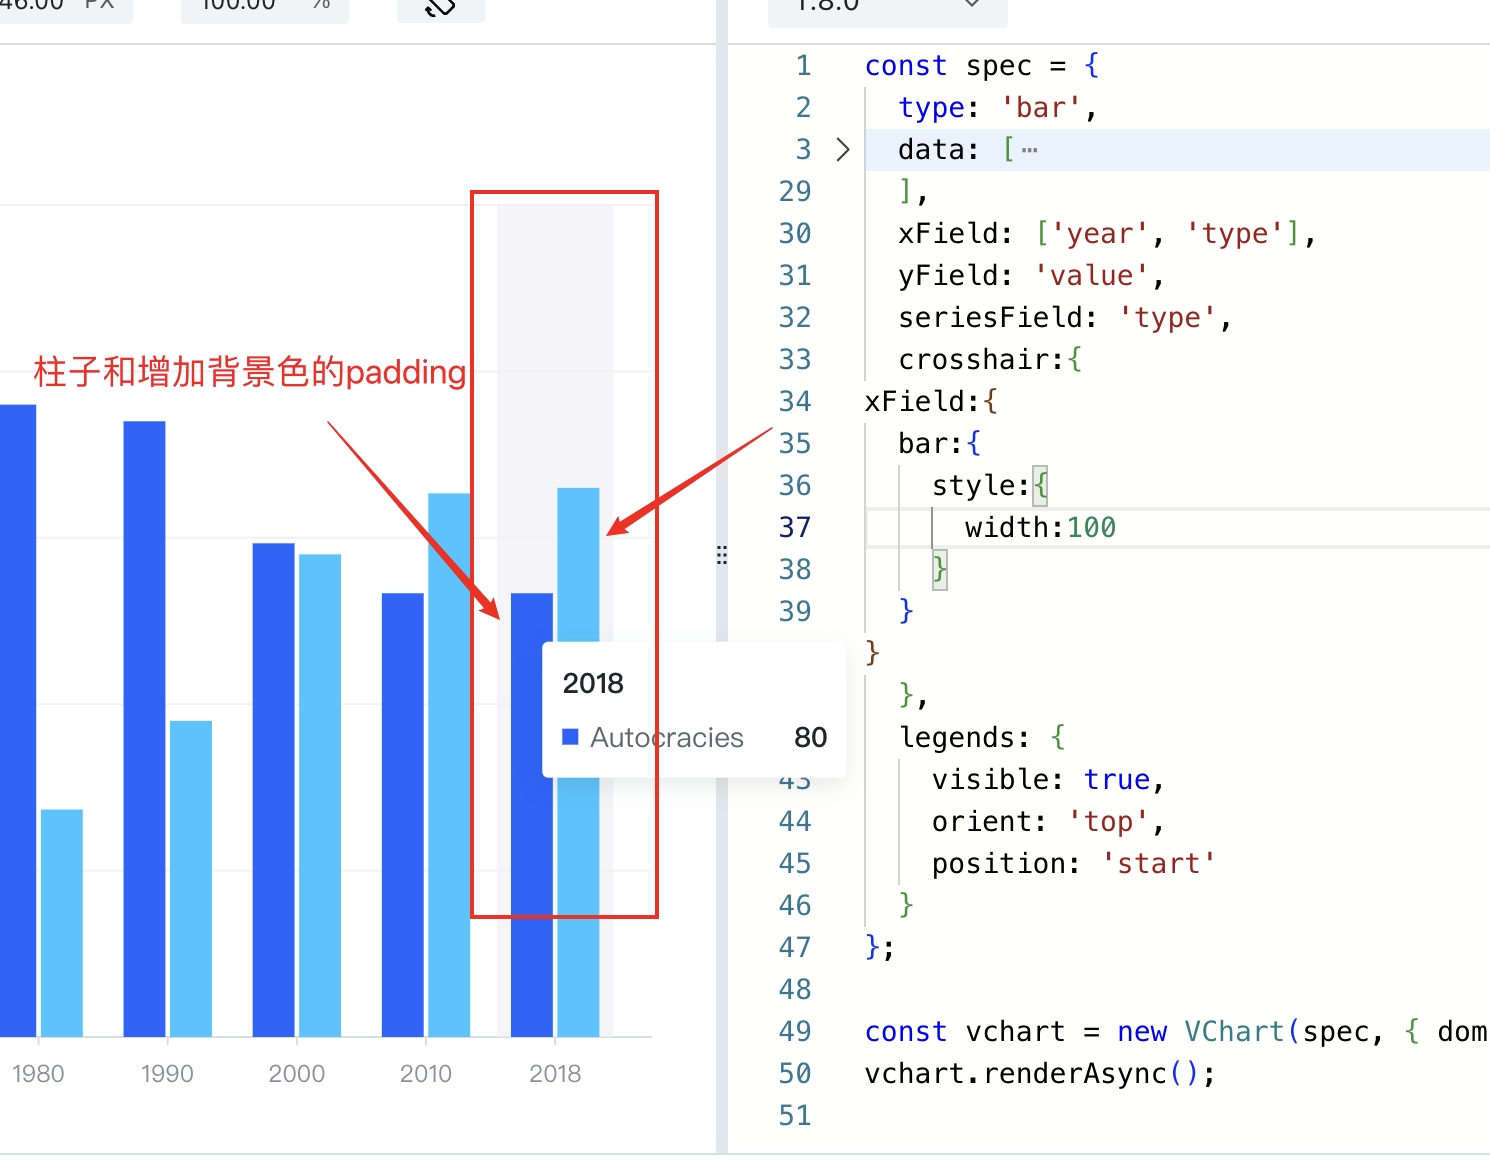
I want to keep some padding between the column background and the column when hovering. How can I set it?
Solution
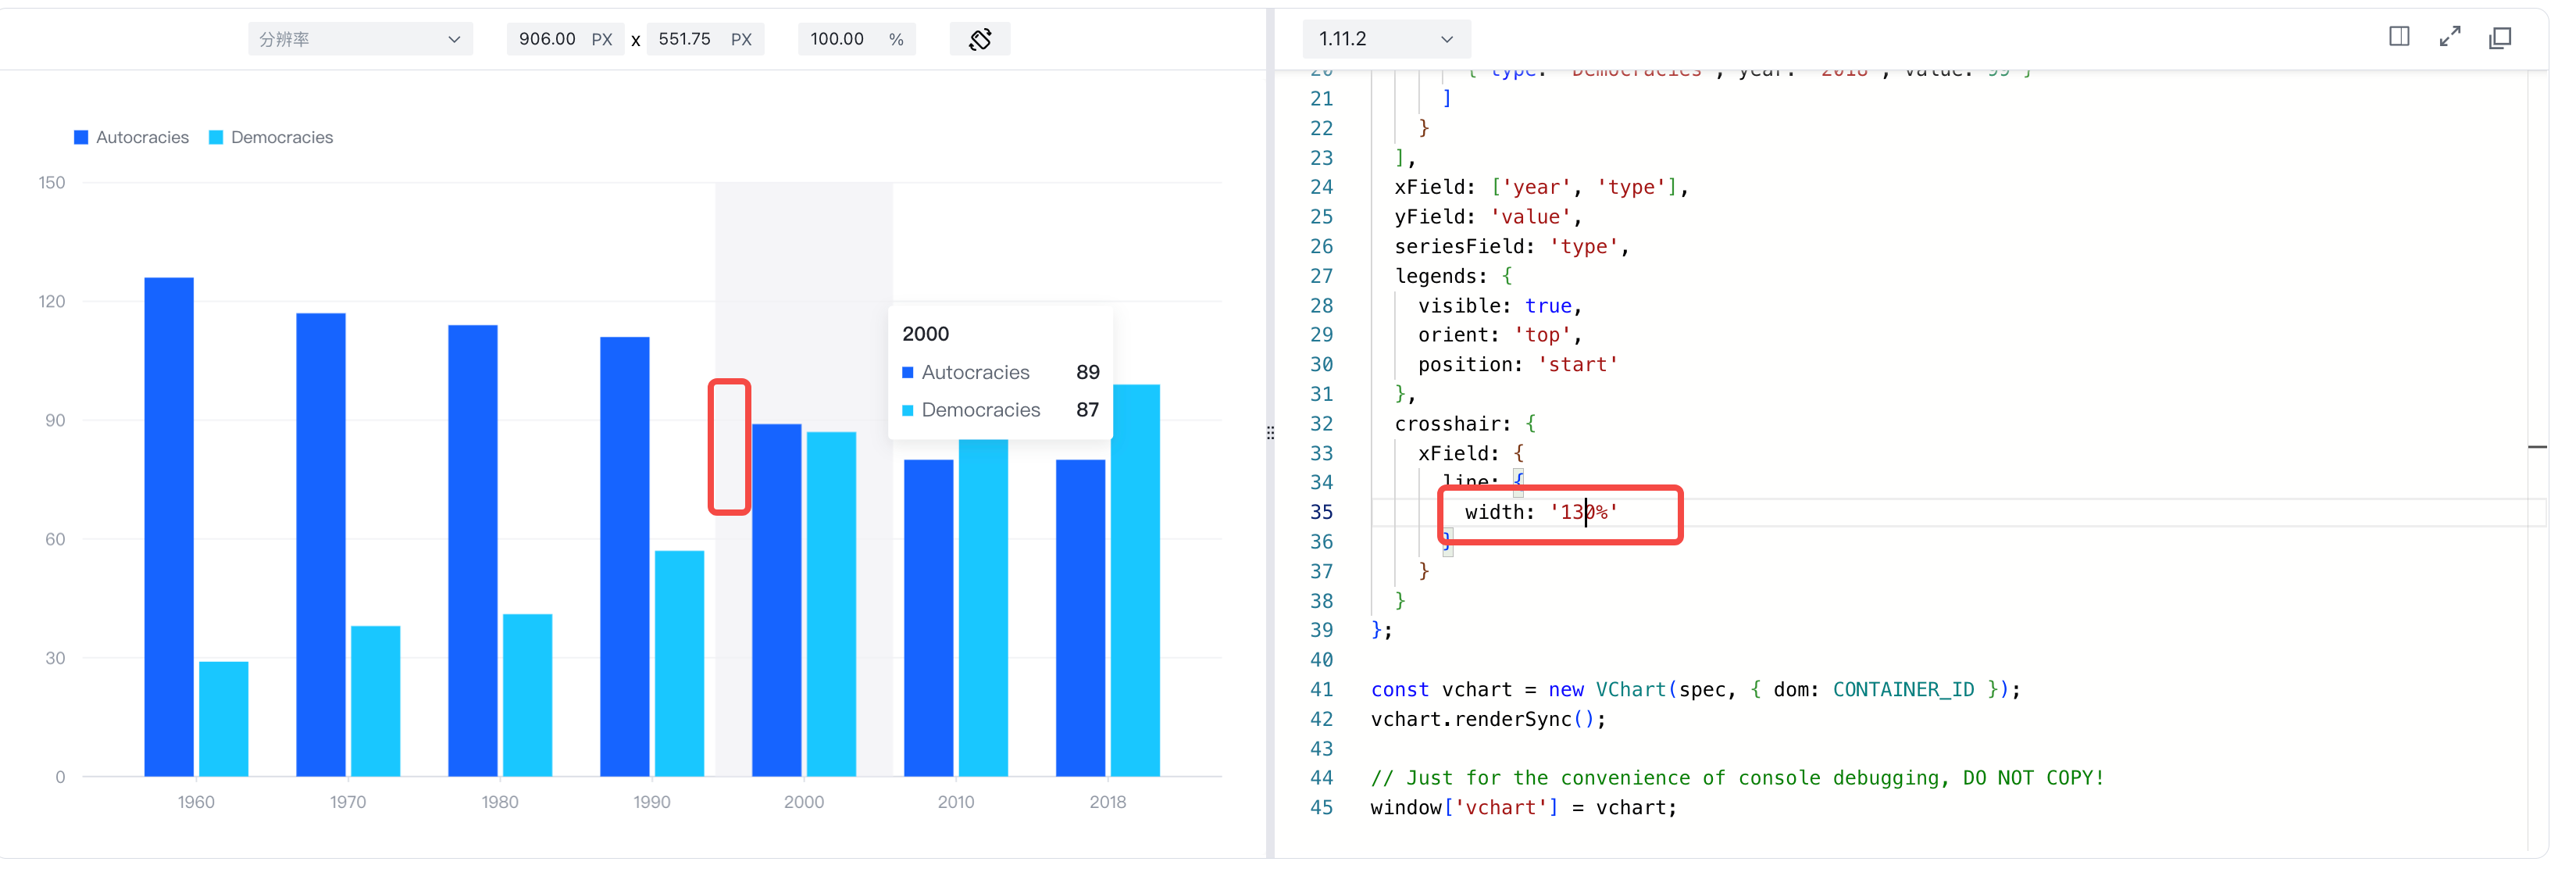
The corsshair component is responsible for displaying the background column during interaction. If you want to leave a gap between the background and the column, you can achieve it by setting the width percentage, for example: set corsshair.xField.line.width: '200%'.
Code Example
const spec = {
  type: 'bar',
  data: [
    {
      id: 'barData',
      values: [
        { type: 'Autocracies', year: '1960', value: 126 },
        { type: 'Autocracies', year: '1970', value: 117 },
        { type: 'Autocracies', year: '1980', value: 114 },
        { type: 'Autocracies', year: '1990', value: 111 },
        { type: 'Autocracies', year: '2000', value: 89 },
        { type: 'Autocracies', year: '2010', value: 80 },
        { type: 'Autocracies', year: '2018', value: 80 },
        { type: 'Democracies', year: '1960', value: 29 },
        { type: 'Democracies', year: '1970', value: 38 },
        { type: 'Democracies', year: '1980', value: 41 },
        { type: 'Democracies', year: '1990', value: 57 },
        { type: 'Democracies', year: '2000', value: 87 },
        { type: 'Democracies', year: '2010', value: 98 },
        { type: 'Democracies', year: '2018', value: 99 }
      ]
    }
  ],
  xField: ['year', 'type'],
  yField: 'value',
  seriesField: 'type',
  legends: {
    visible: true,
    orient: 'top',
    position: 'start'
  },
  crosshair: {
    xField: {
      line: {
        width: '130%'
      }
    }
  }
};

const vchart = new VChart(spec, { dom: CONTAINER_ID });
vchart.renderSync();

// Just for the convenience of console debugging, DO NOT COPY!
window['vchart'] = vchart;</br>
Results
Online demo:https://codesandbox.io/p/sandbox/svg-symbol-8k9tdz?file=%2Fsrc%2Findex.ts%3A208%2C29
Related Documentation
Crosshair Tutorial: https://www.visactor.io/vchart/guide/tutorial_docs/Chart_Concepts/Crosshair
Related Api:https://www.visactor.io/vchart/option/barChart#crosshair.xField.line.width
github:https://github.com/VisActor/VChart