
Title
How to configure primitive hover status?
Description
How to enable hover highlighting effect of graphic elements?
Solution
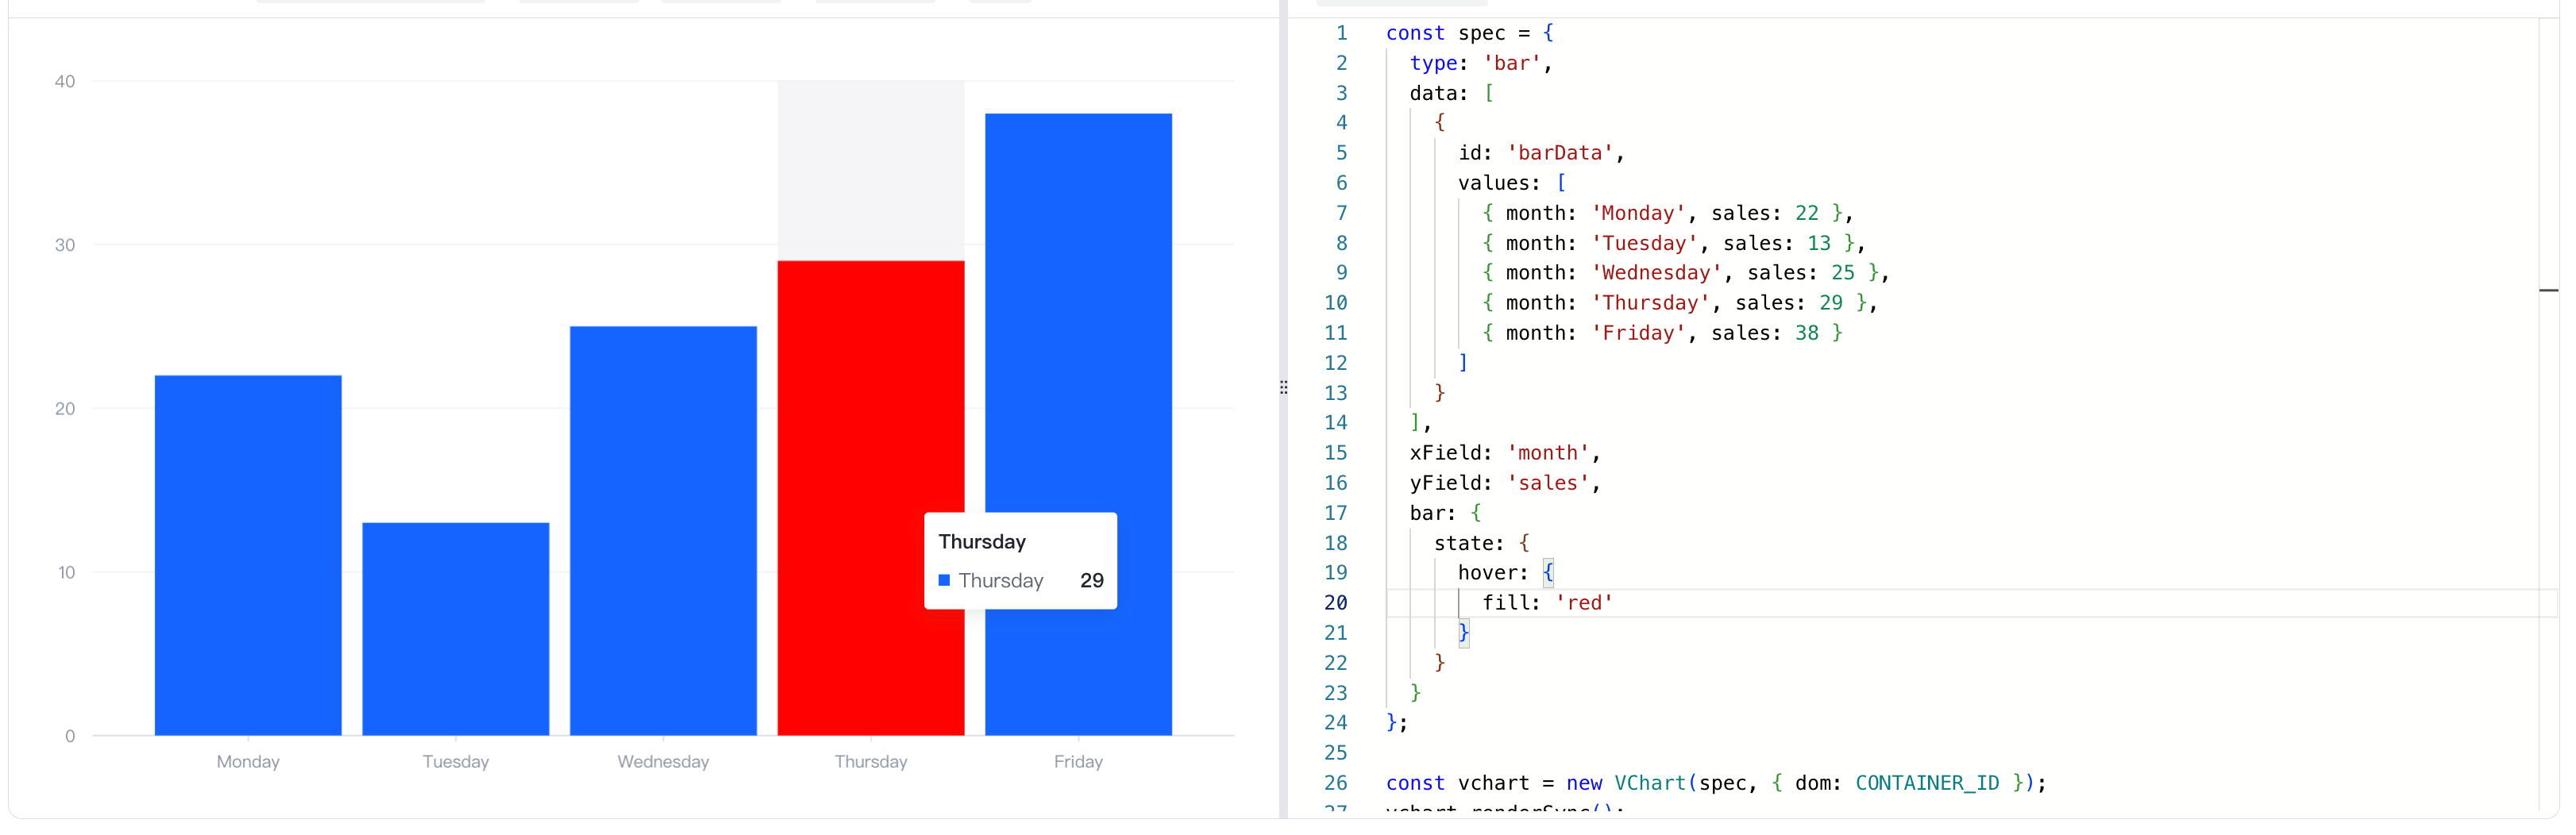
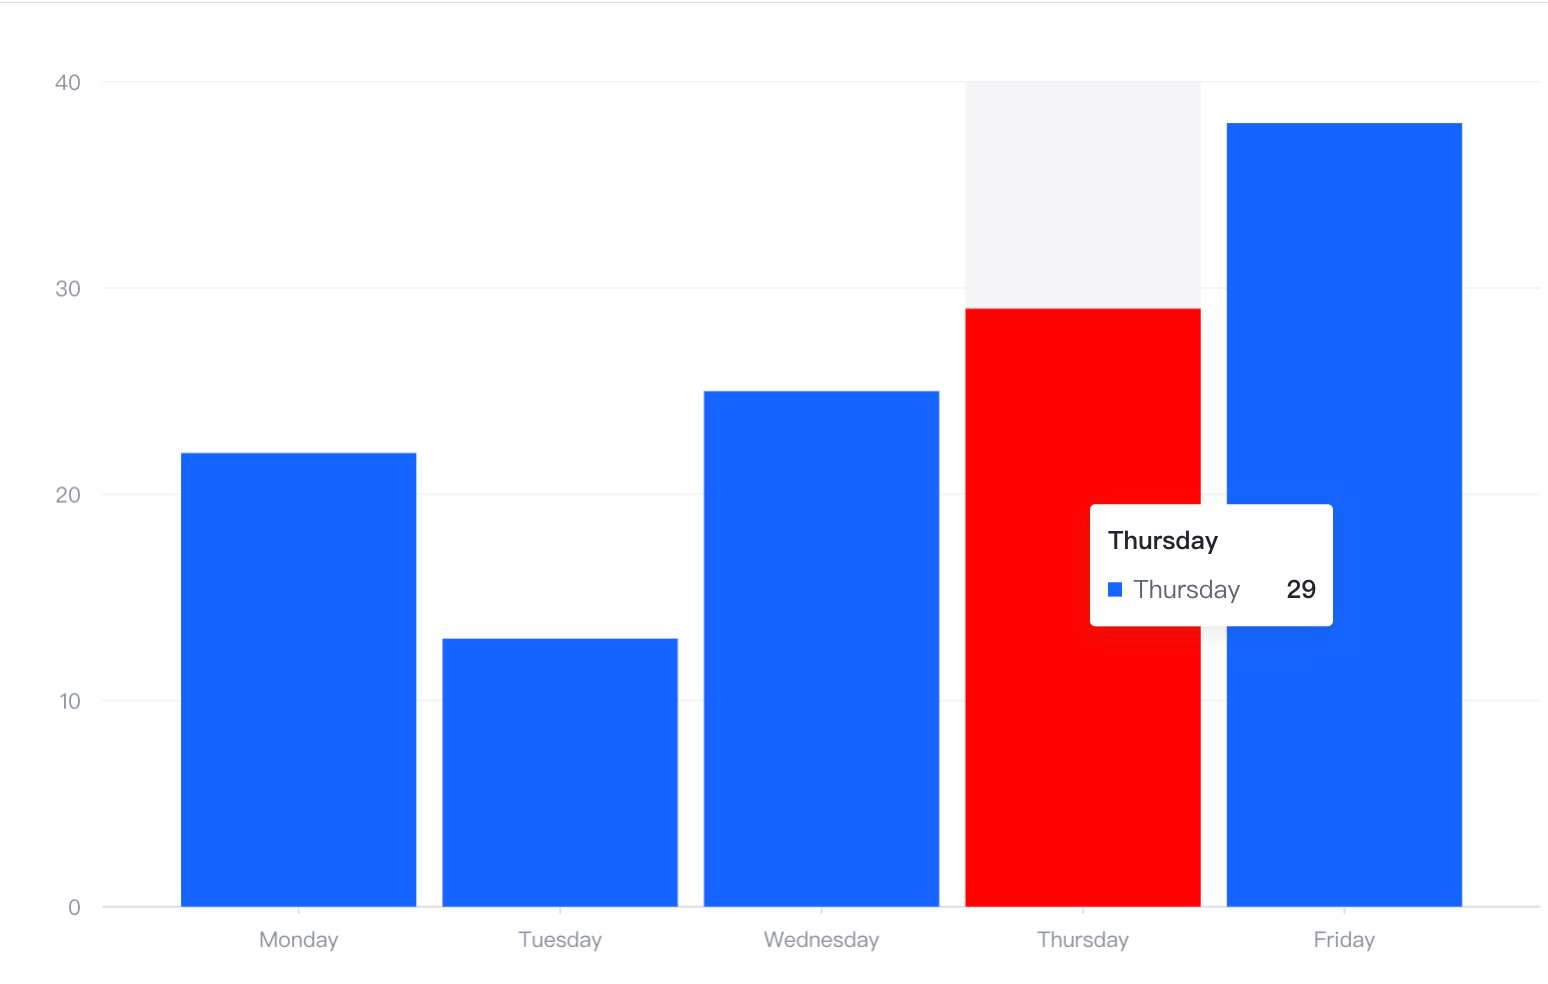
Taking a bar chart as an example, the highlight effect after hovering can be configured through bar.state.hover.
Different charts need to be configured on different elements. Similarly, line charts are configured through line.state.hover.
Code Example
const spec = {
  type: 'bar',
  data: [
    {
      id: 'barData',
      values: [
        { month: 'Monday', sales: 22 },
        { month: 'Tuesday', sales: 13 },
        { month: 'Wednesday', sales: 25 },
        { month: 'Thursday', sales: 29 },
        { month: 'Friday', sales: 38 }
      ]
    }
  ],
  xField: 'month',
  yField: 'sales',
  bar: {
    state: {
      hover: {
        fill: 'red'
      }
    }
  }
};

const vchart = new VChart(spec, { dom: CONTAINER_ID });
vchart.renderSync();

// Just for the convenience of console debugging, DO NOT COPY!
window['vchart'] = vchart;</br>
Results
Online demo:https://codesandbox.io/p/sandbox/hover-state-z5djy8?file=%2Fsrc%2Findex.ts%3A12%2C42
Related Documentation
Related API:https://www.visactor.io/vchart/option/barChart#bar.state
Github:https://github.com/VisActor/VChart