How to achieve line break effect for pie chart labels?
Solution
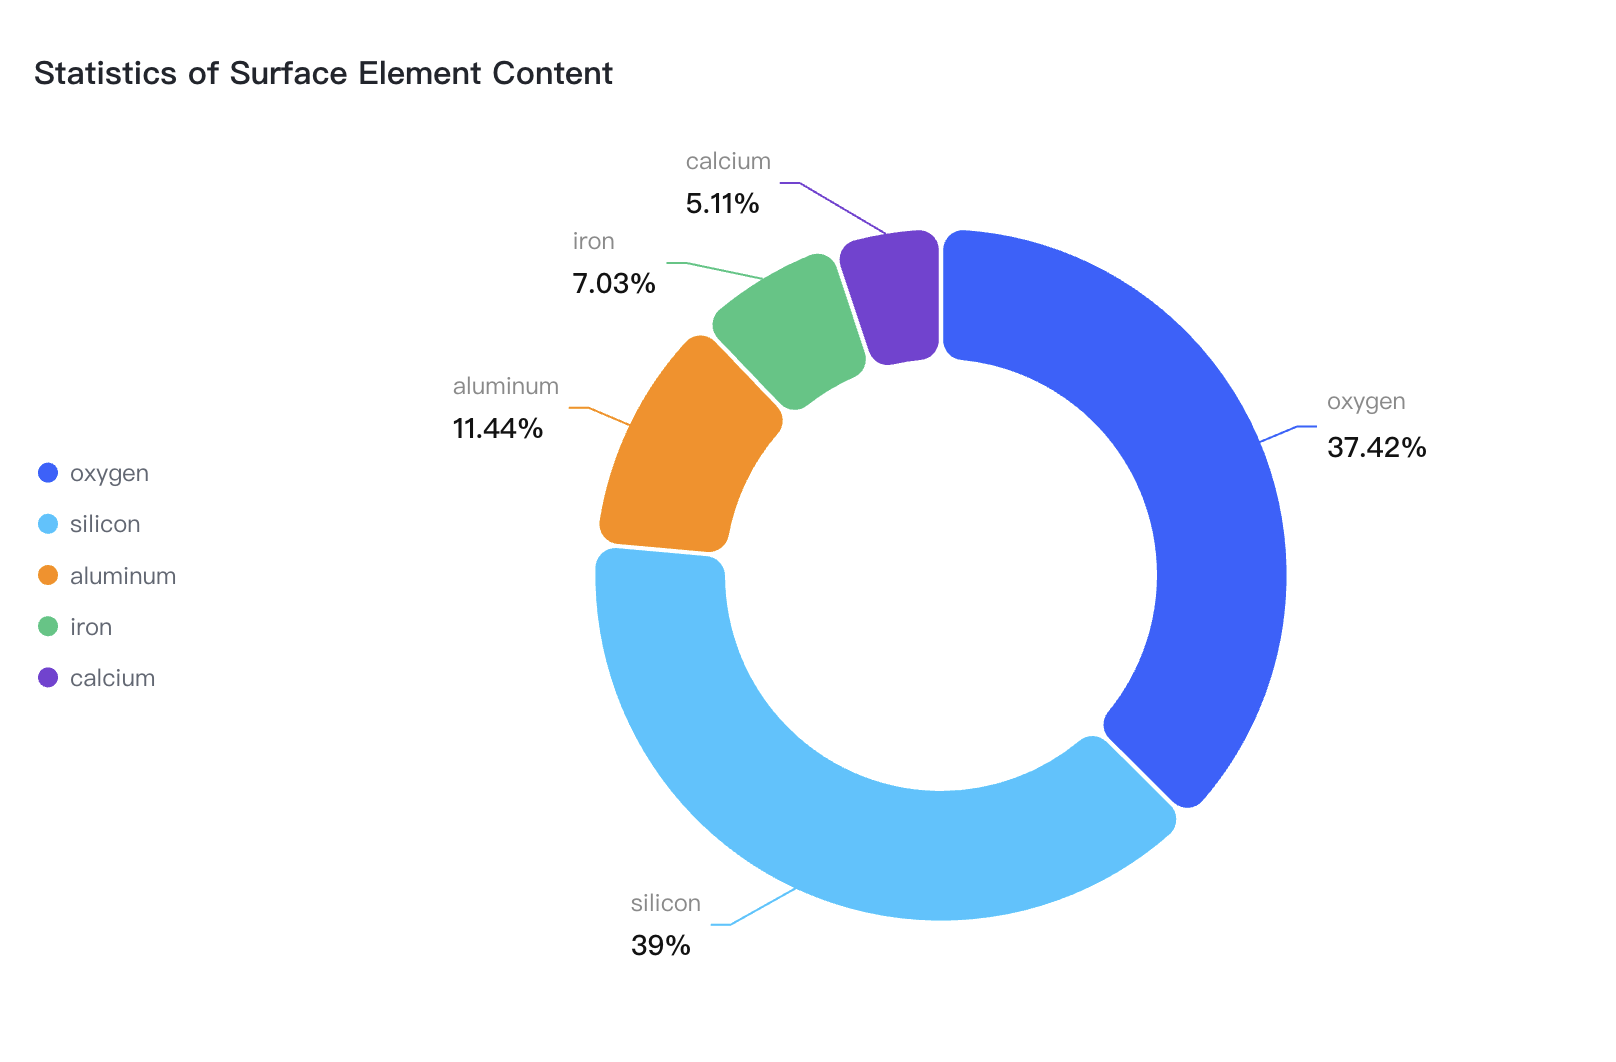
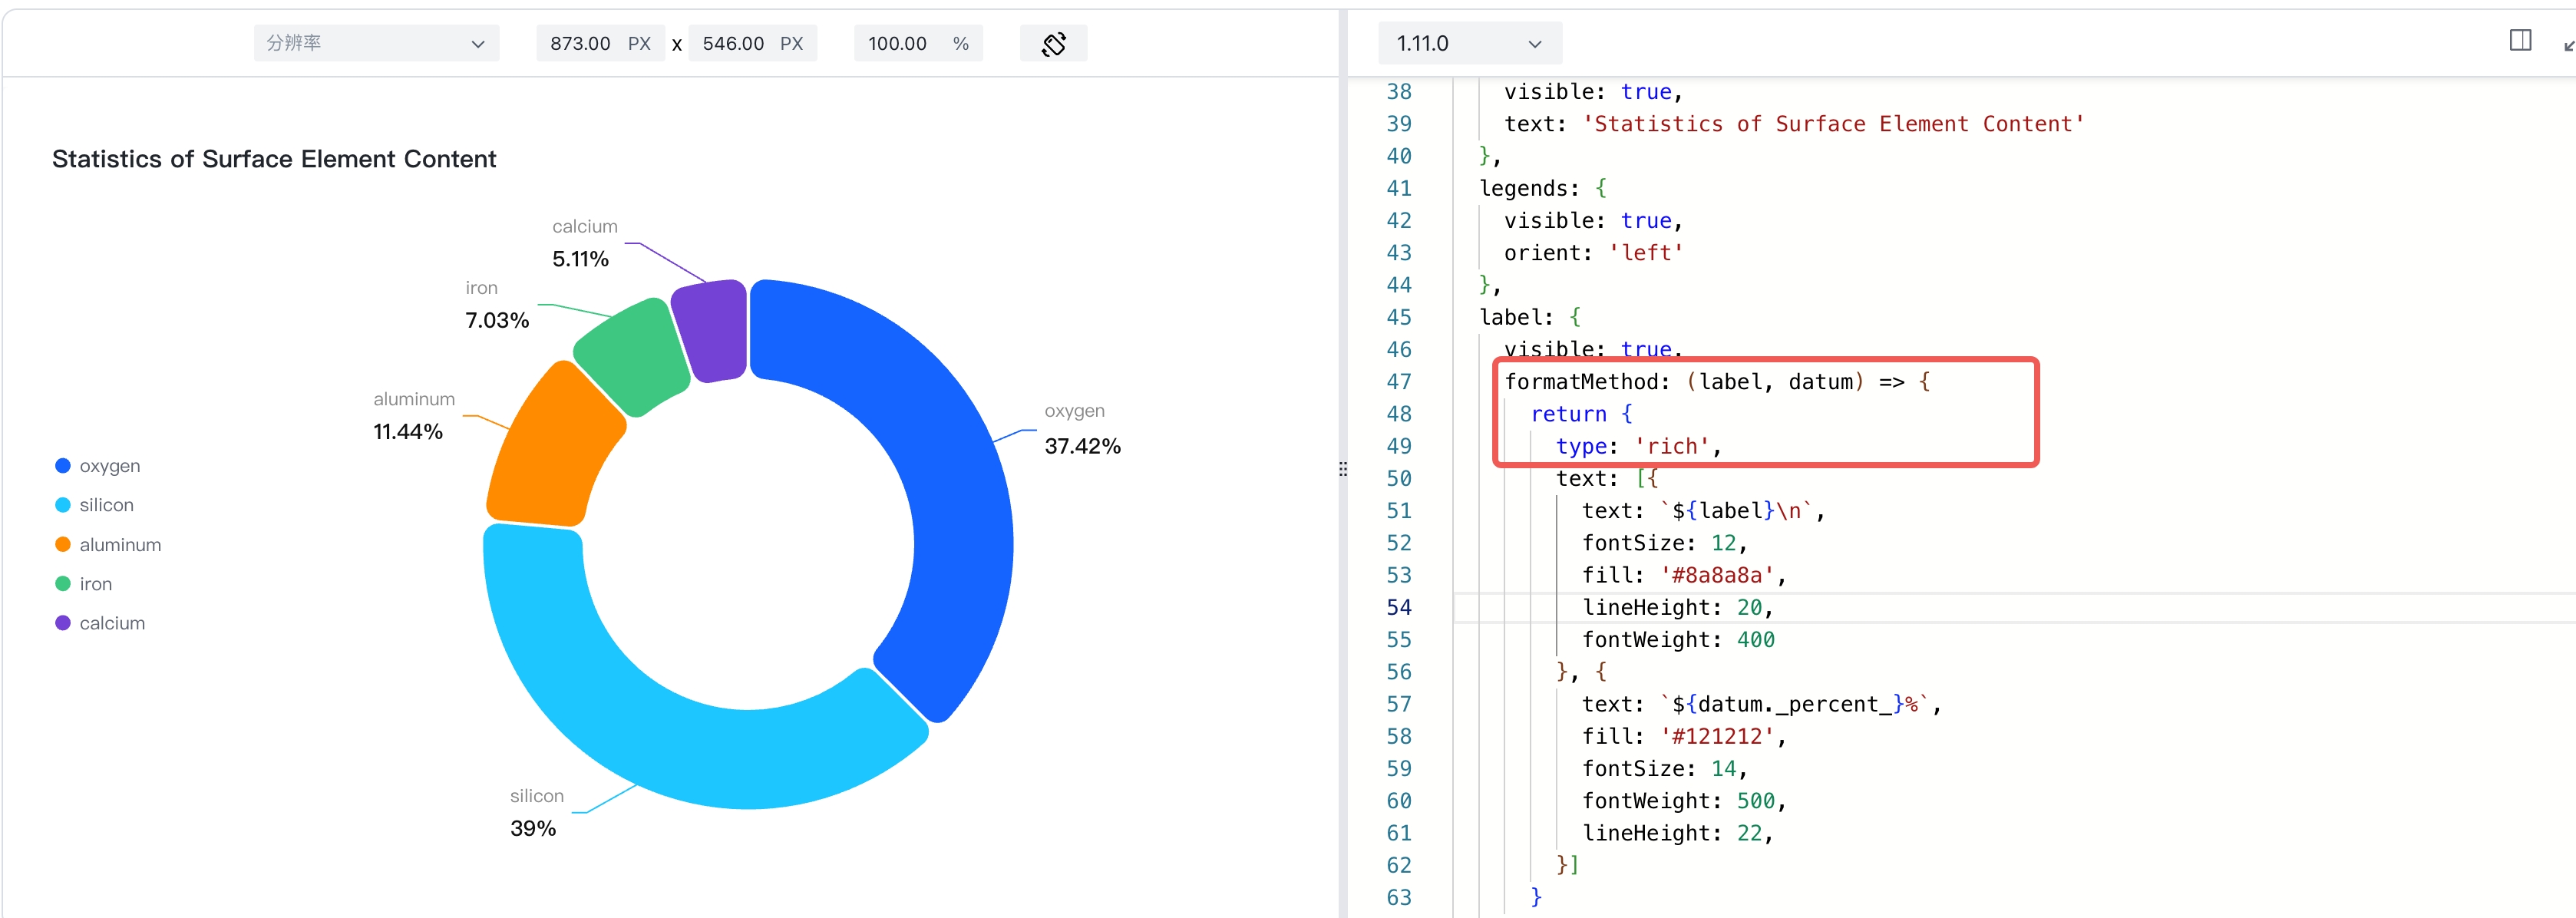
The pie chart label supports the formatting method. In the formatting method, we can switch the label to rich text by setting type: rich in the return object; rich text supports common line breaks, ICONS, and image displays.
Code Examples
const spec = {
  type: 'pie',
  data: [
    {
      id: 'id0',
      values: [
        { type: 'oxygen', value: '26.60' },
        { type: 'silicon', value: '27.72' },
        { type: 'aluminum', value: '8.13' },
        { type: 'iron', value: '5' },
        { type: 'calcium', value: '3.63' },
      ]
    }
  ],
  outerRadius: 0.8,
  innerRadius: 0.5,
  padAngle: 0.6,
  valueField: 'value',
  categoryField: 'type',
  pie: {
    style: {
      cornerRadius: 10
    },
    state: {
      hover: {
        outerRadius: 0.85,
        stroke: '#000',
        lineWidth: 1
      },
      selected: {
        outerRadius: 0.85,
        stroke: '#000',
        lineWidth: 1
      }
    }
  },
  title: {
    visible: true,
    text: 'Statistics of Surface Element Content'
  },
  legends: {
    visible: true,
    orient: 'left'
  },
  label: {
    visible: true,
    formatMethod: (label, datum) => {
      return {
        type: 'rich',
        text: [{
          text: `${label}\n`,
          fontSize: 12,
          fill: '#8a8a8a',
          lineHeight: 20,
          fontWeight: 400
        }, {
          text: `${datum._percent_}%`,
          fill: '#121212',
          fontSize: 14,
          fontWeight: 500,
          lineHeight: 22,
        }]
      }
    }
  },
  tooltip: {
    mark: {
      content: [
        {
          key: datum => datum['type'],
          value: datum => datum['value'] + '%'
        }
      ]
    }
  }
};

const vchart = new VChart(spec, { dom: CONTAINER_ID });
vchart.renderSync();

// Just for the convenience of console debugging, DO NOT COPY!
window['vchart'] = vchart;</br>
Result Presentation