!!!###!!!title=VisActor Agent - From data to visual work!!!###!!!
!!!###!!!description=Create charts, infographics, data stories and spatial presentations with VisActor Agent.!!!###!!!
Agent
From data to
visual work
, in one prompt.
Checking today’s chat quota…
Custom chart
VChart
Interactive table
VTable
Create a multi-series combo chart with zoom and filtering.
Build a custom dual-axis chart with annotations and interaction.
Visualize revenue trends with an interactive branded theme.
VChart examples
Reuse example
Metric change waterfall
Reuse example
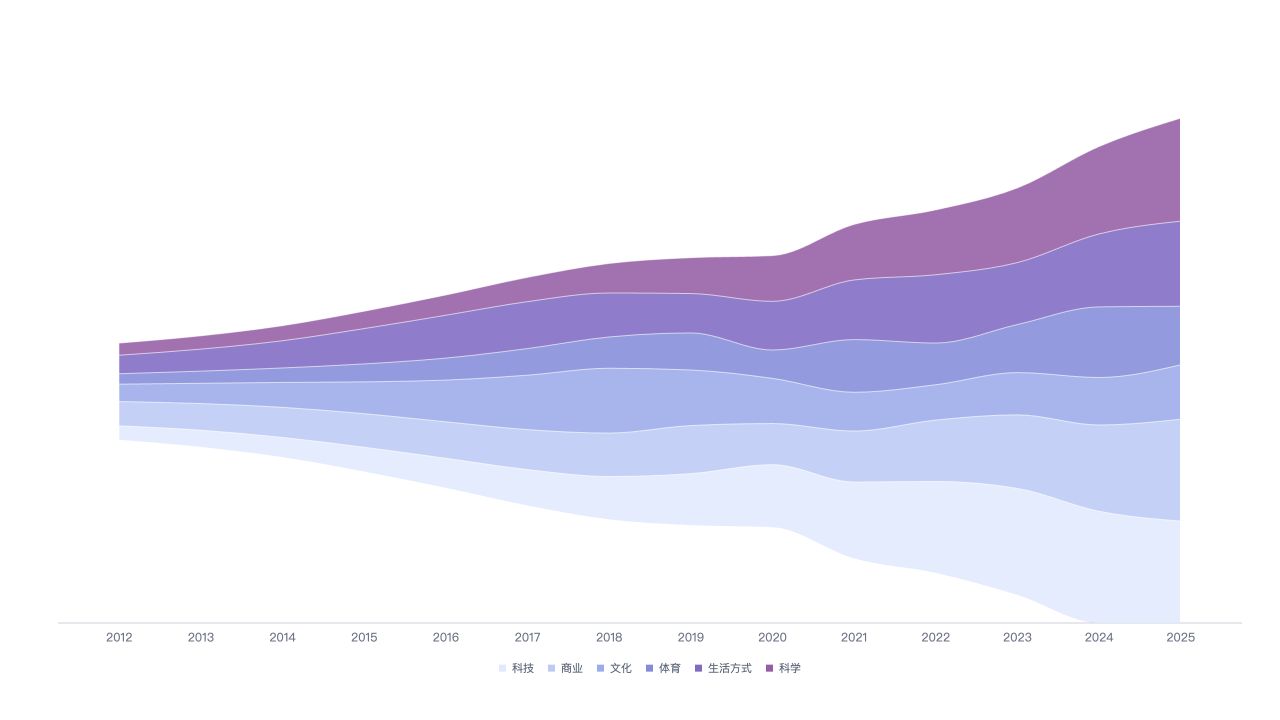
Content interest streamgraph
Reuse example
Power and efficiency scatter
Reuse example
Product revenue treemap
Reuse example
Purchase conversion funnel
Reuse example
User age population pyramid
Reuse example
Conversion path Sankey
Reuse example
Multi-market long-term trends